Watt Window® solutions for unique needs
Energy clarity, for every industry and role
Watt Window turns production energy use and machine risks into actionable insights, whatever type of plant you run, build, or support.
Our tools adapt to the full range of industrial priorities and needs, … most importantly, to yours.
Explore industry- and role-specific solutions
We work with factory teams to ensure our custom solutions truly fit their unique needs. (More coming.)
Solutions by role
Consultants

Electrical contractors

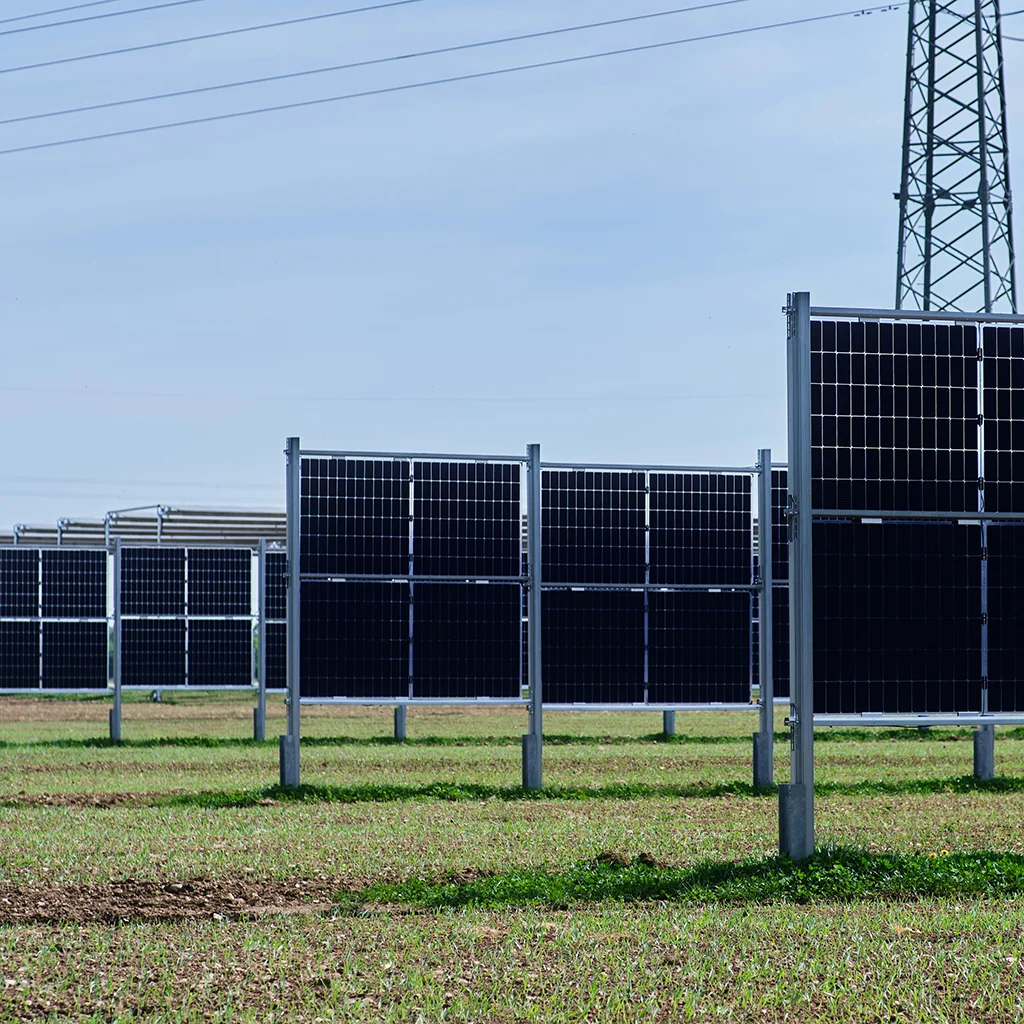
Solar installers
Solutions by Industry
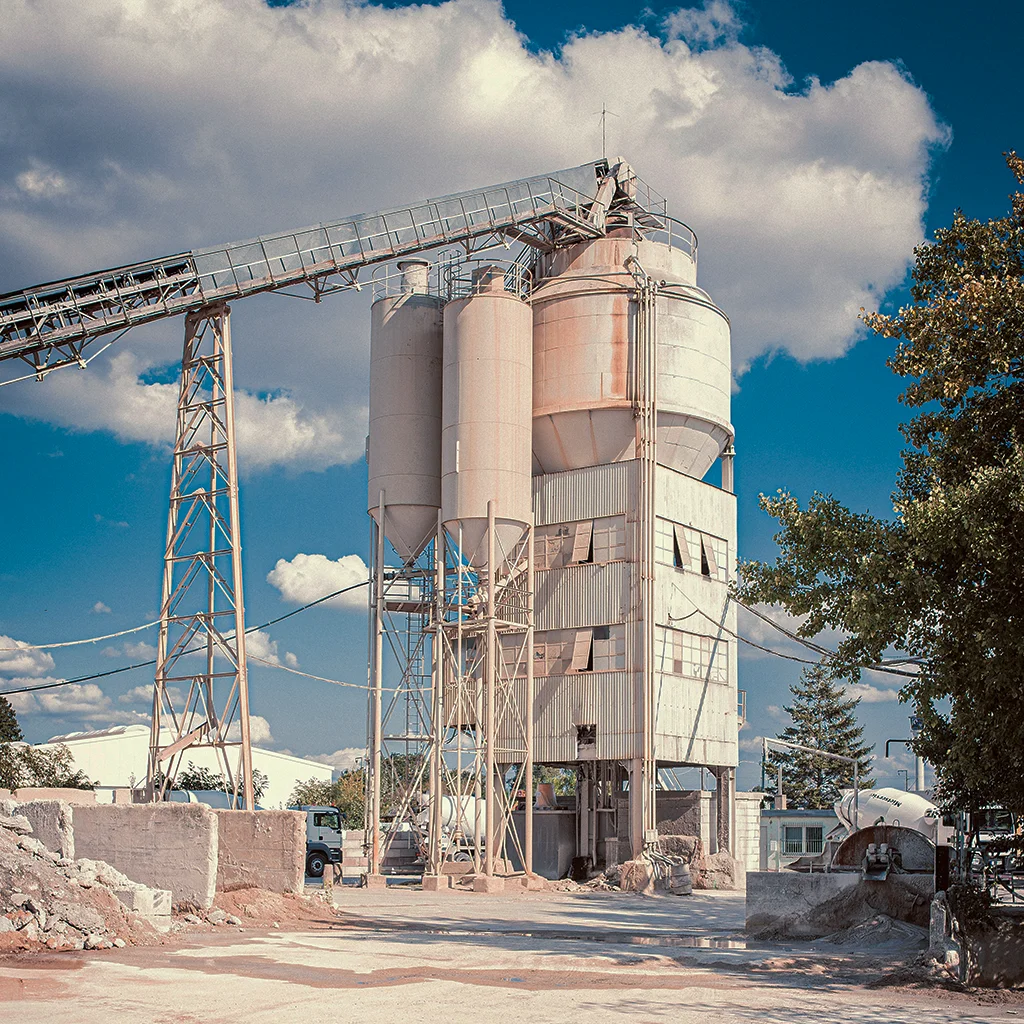
Cement
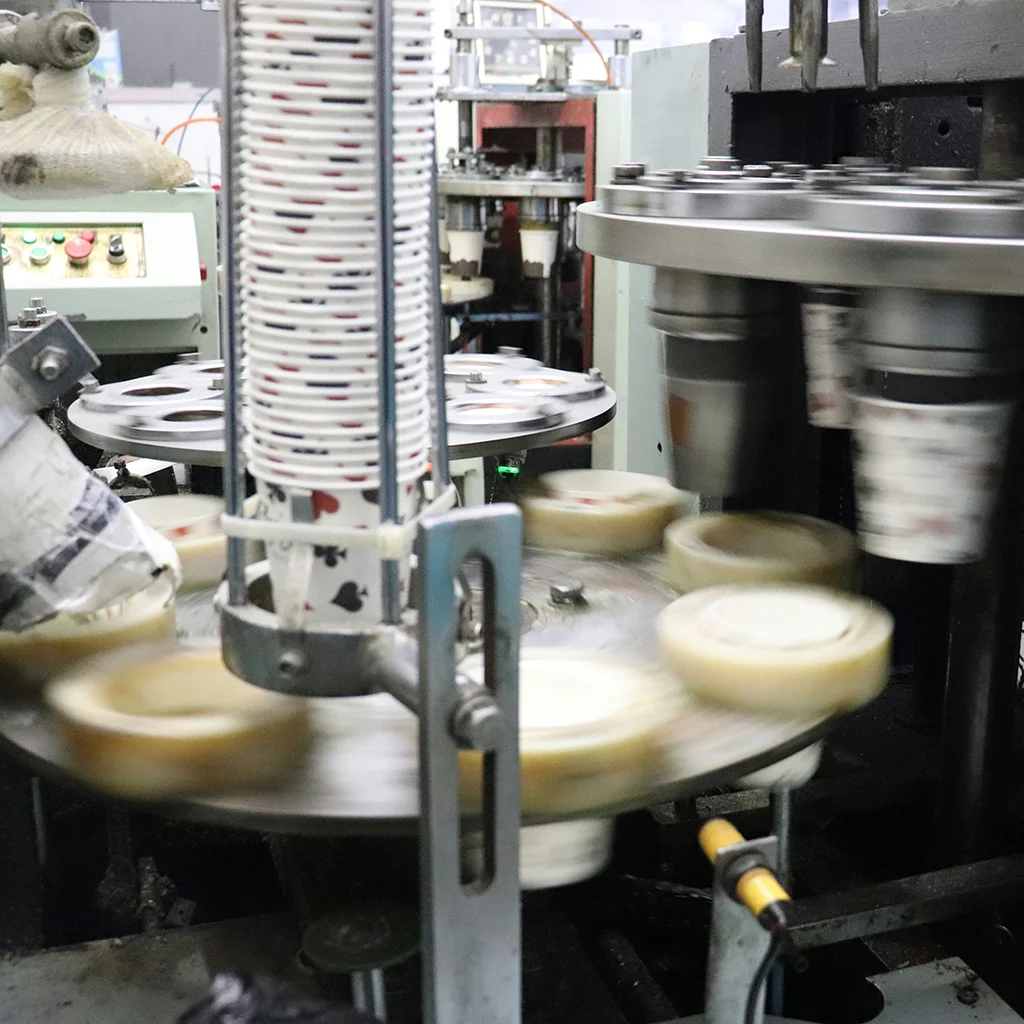
Contract manufacturing & co-packing
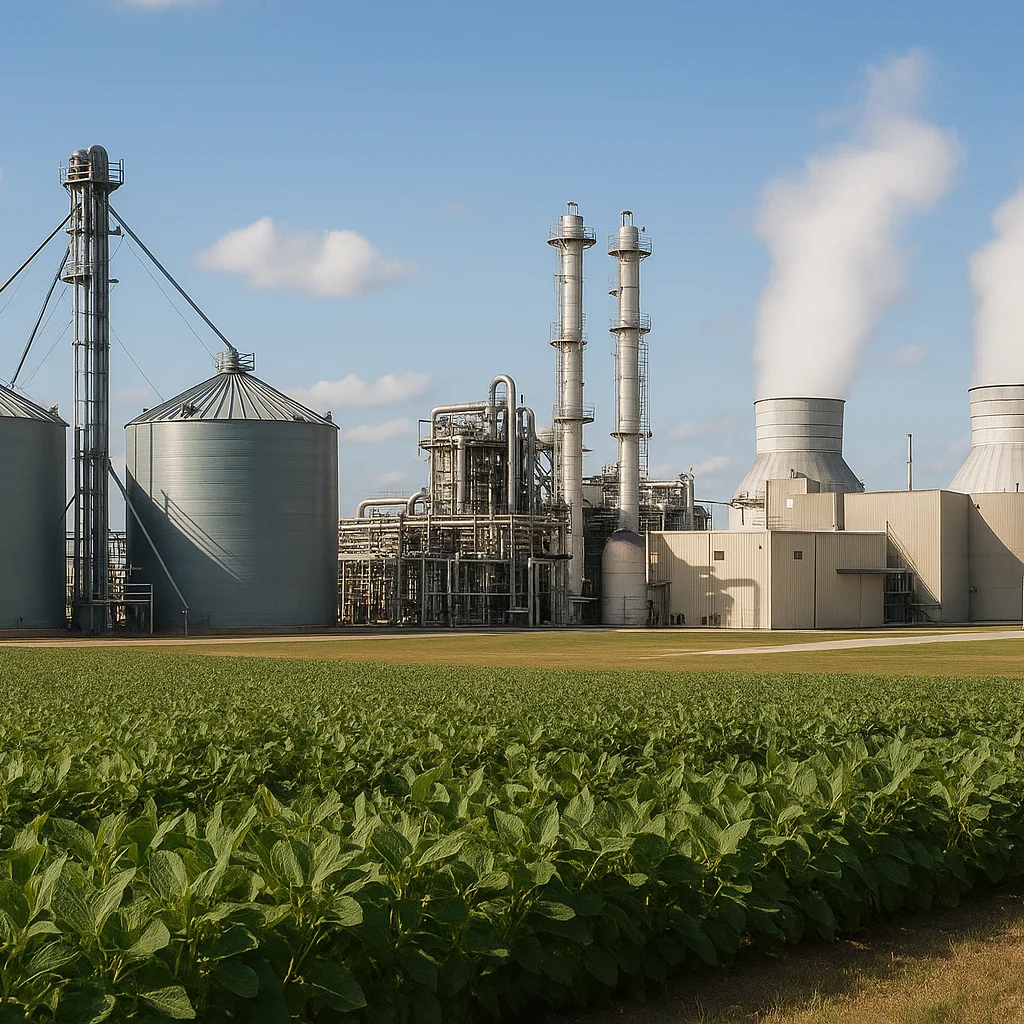
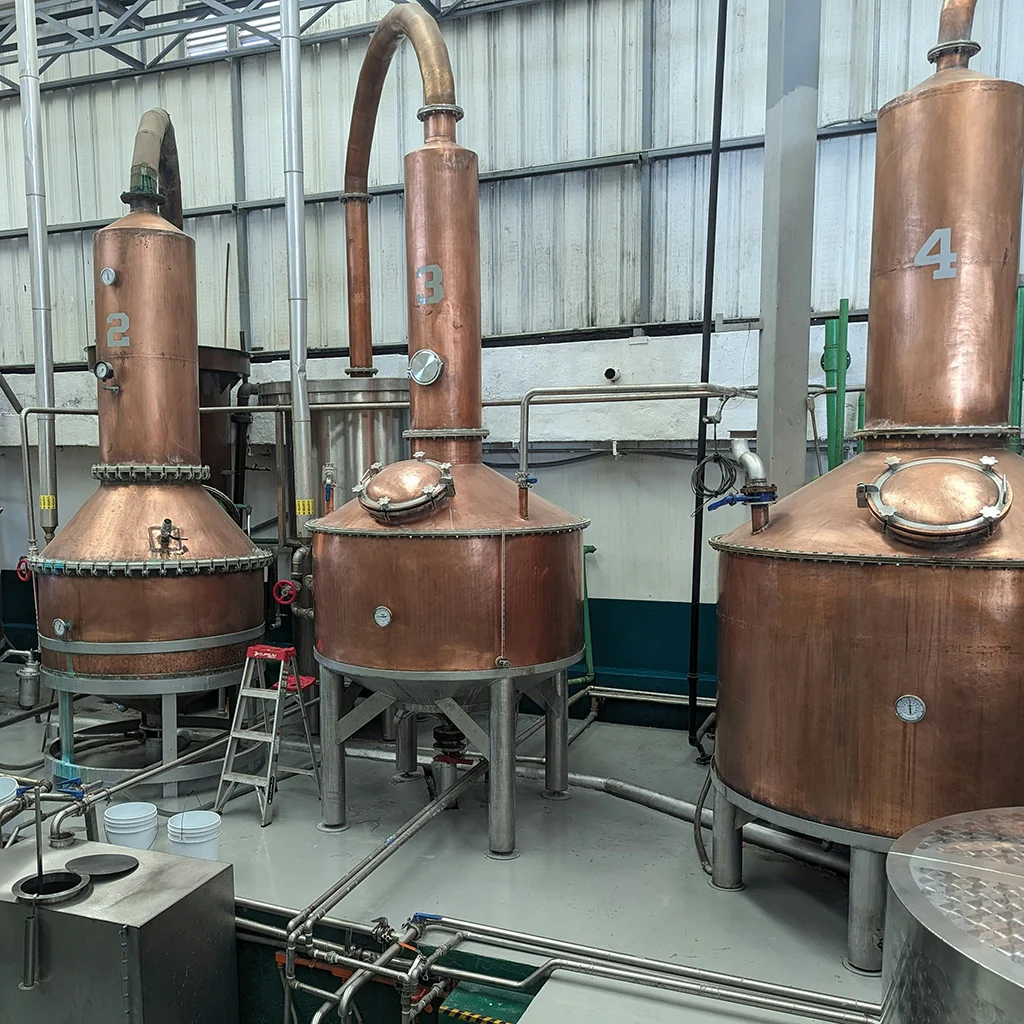
Ethanol
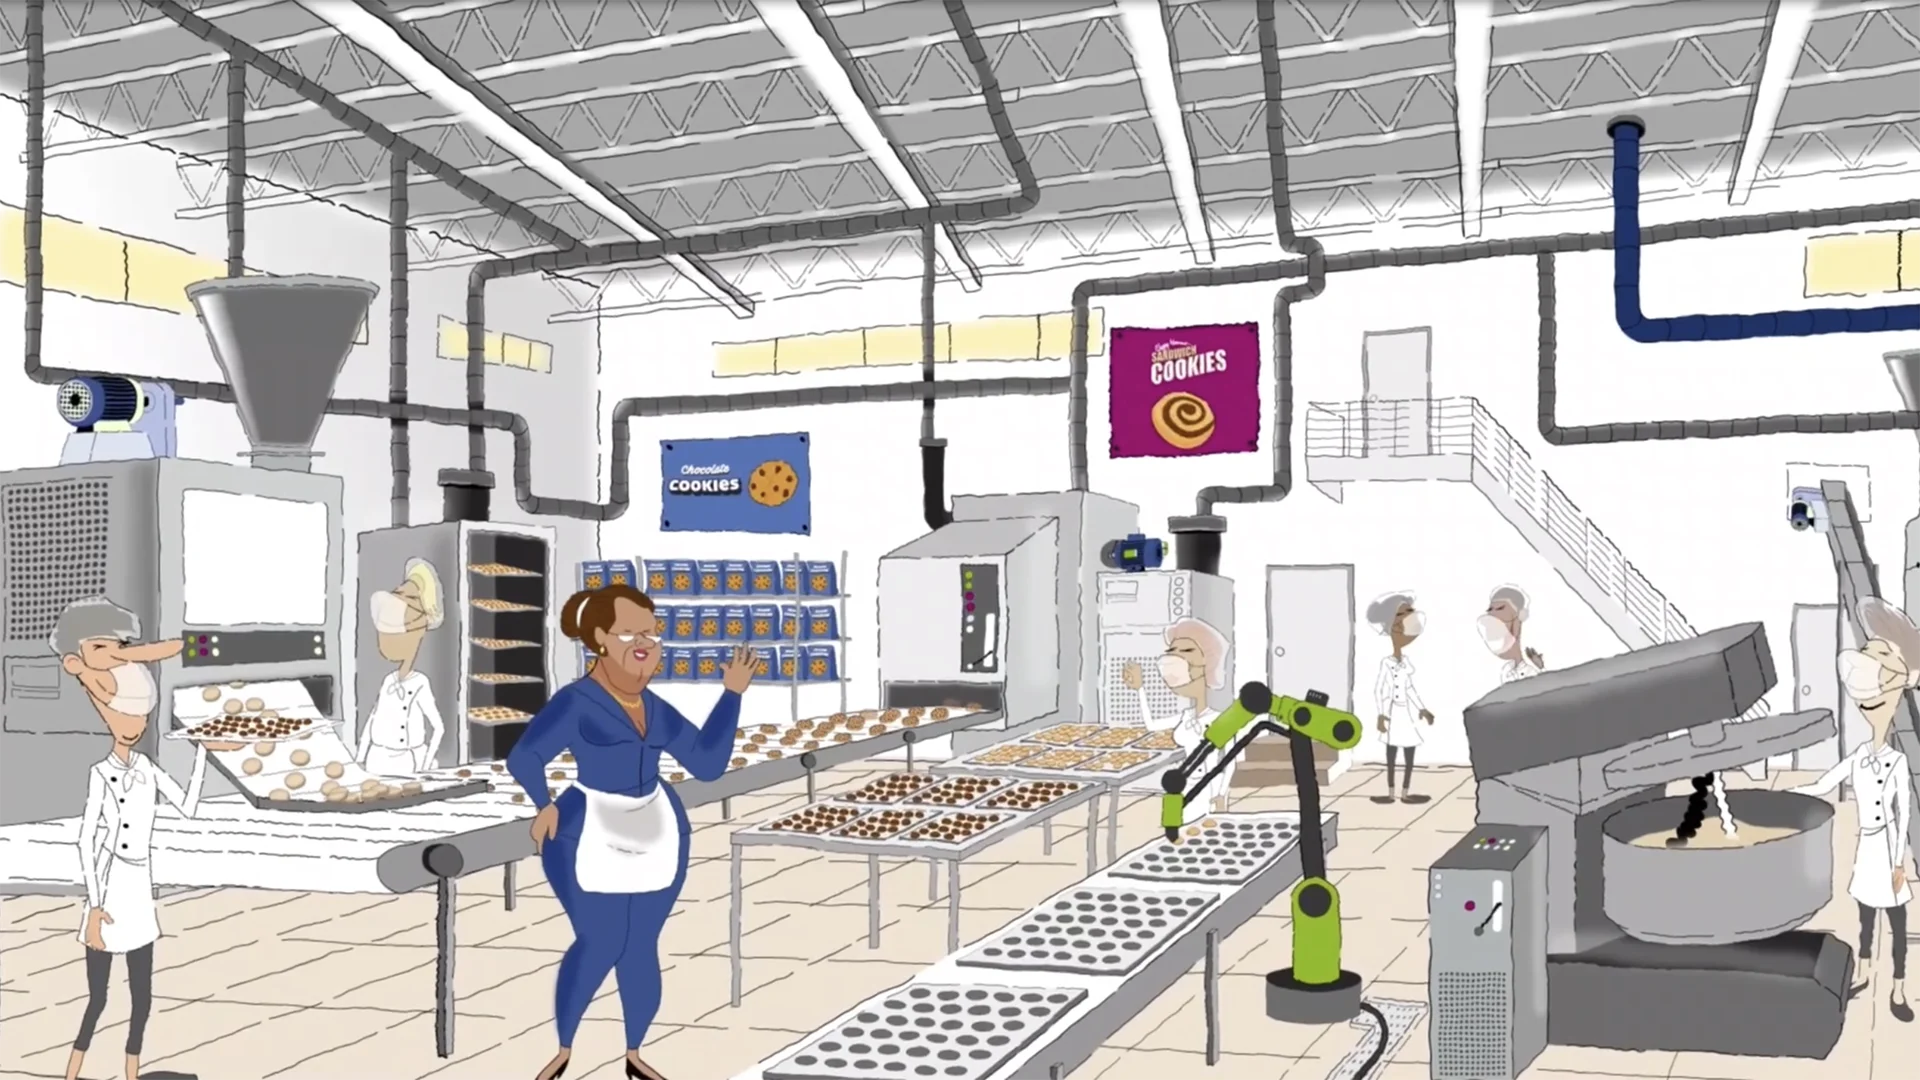
Food & Animal feed
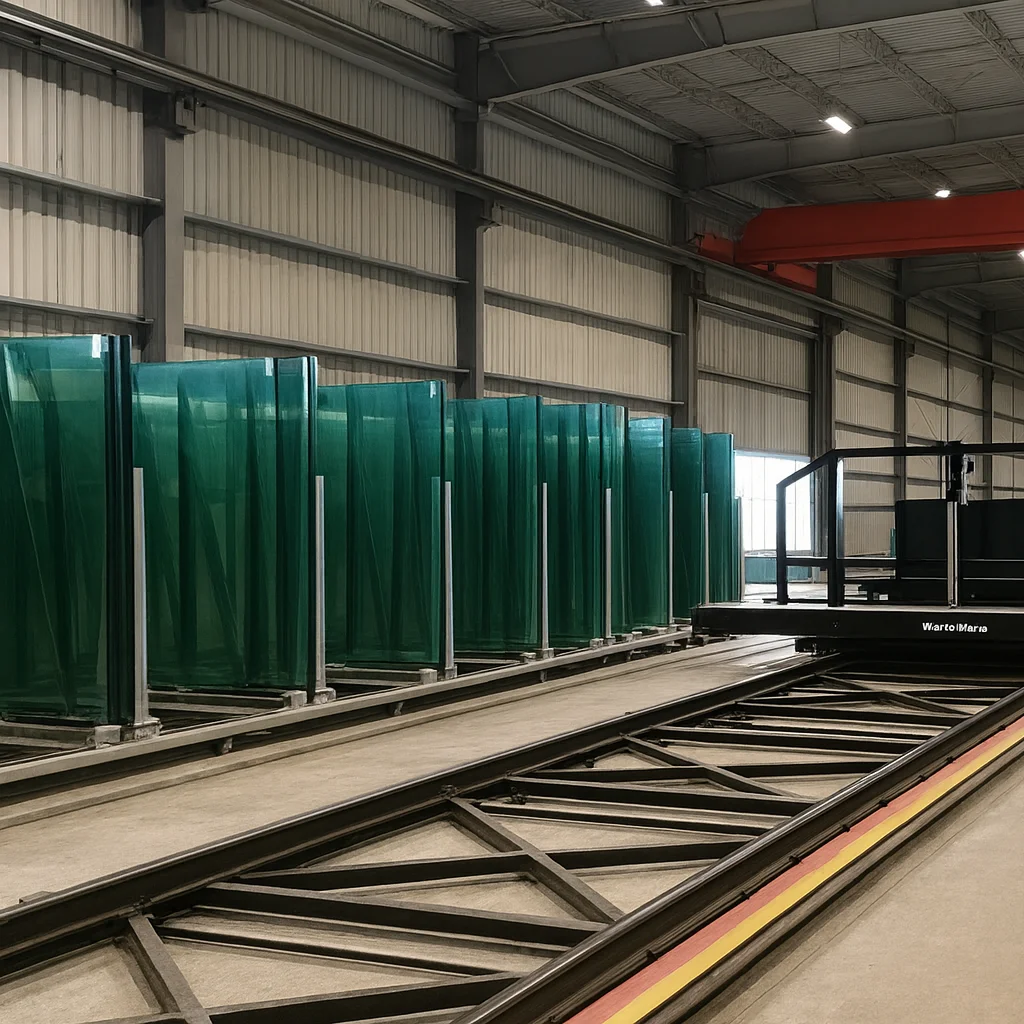
Glass
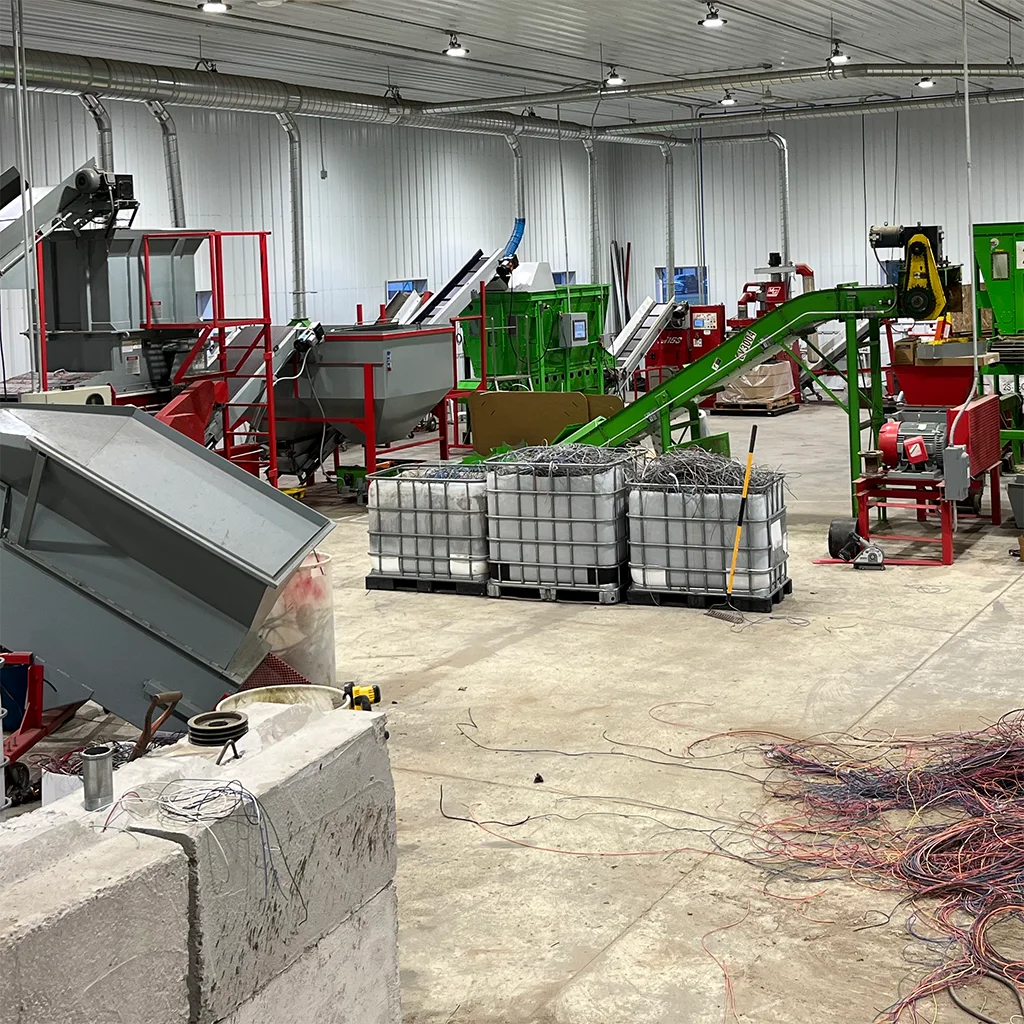
Metal recycling
Didn’t see your role or sector?
We built Watt Window to flex to any industrial facility, even ones not listed yet.
If you have questions specific to your situation, just say hi. We’d love to share how we can already help you or work with you to adapt our solution to your situation.
Our solution is easy to adapt to your needs
Ever since our early prototypes, we built our solution so it could fit what you need.
Benefits like universal machine brand compatibility with standardized data output, custom route design and naming, near-live data flow, easy installation by licensed electrical installers, and more make Watt Window trouble-free to match to your plant and SOPs.
See how Watt Window helps small shops, large plants, and everyone in between.
Unlock tailored Energy Savings With Smart Metering
Discover how our solution can offer route-level, operations grade (< 2% error) energy visibility, predictive maintenance, and carbon tracking that work for you.