
How Watt Window® helps industrial consultants
Prove more value with new data-driven energy insights
As you assess plants, benchmark efficiency, or plan retrofits, Watt Window gives you machine-level energy and equipment-health data. That lets you show clients real performance before and after your work and back your recommendations with evidence.
Actionable Insights for industrial consultants

Clear diagnostic data
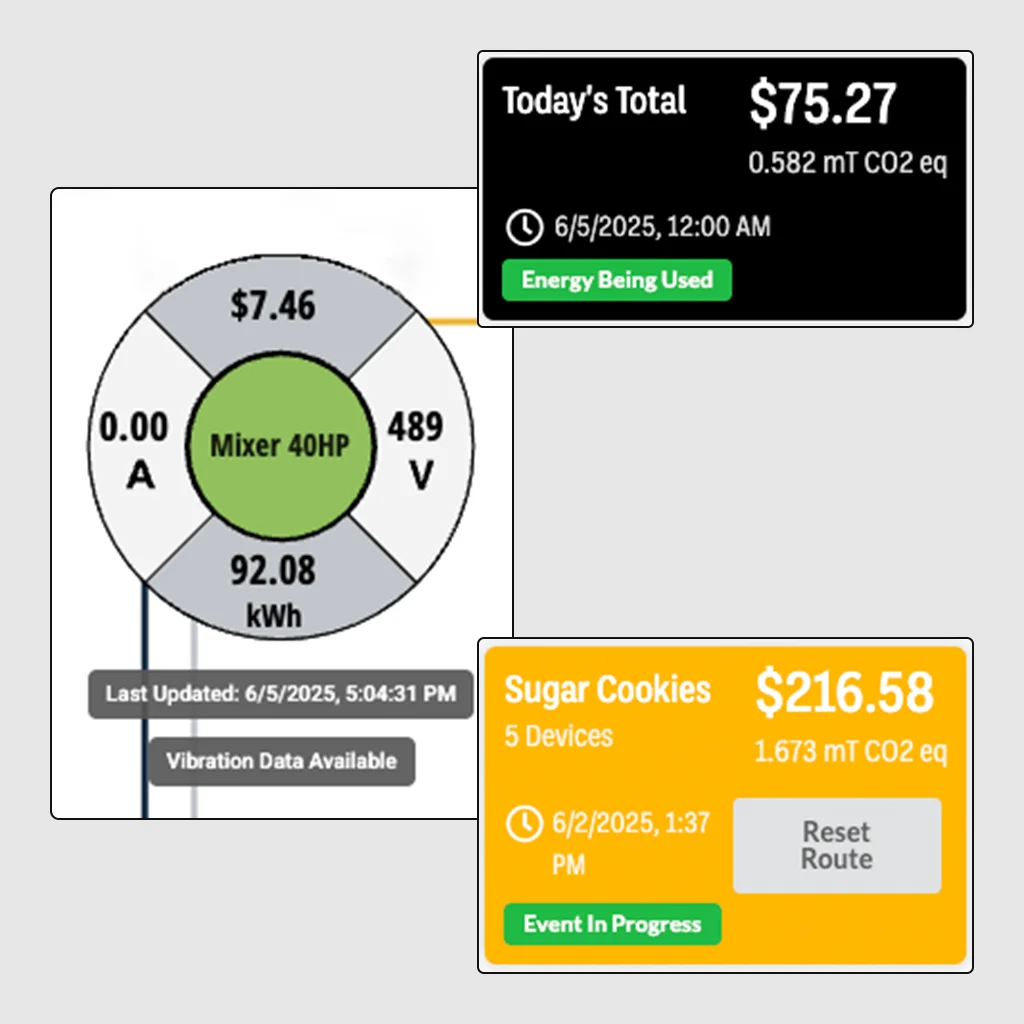
Move beyond energy assumptions and estimates with measured energy and load behavior at machine and line level.

Credible validation
Support recommendations with before-and-after data that clients can trust and act on.

Flexible use in the field
Apply the same system for baselining, spot analysis, or extended monitoring, depending on the engagement.
Get savings and ROI from new data.
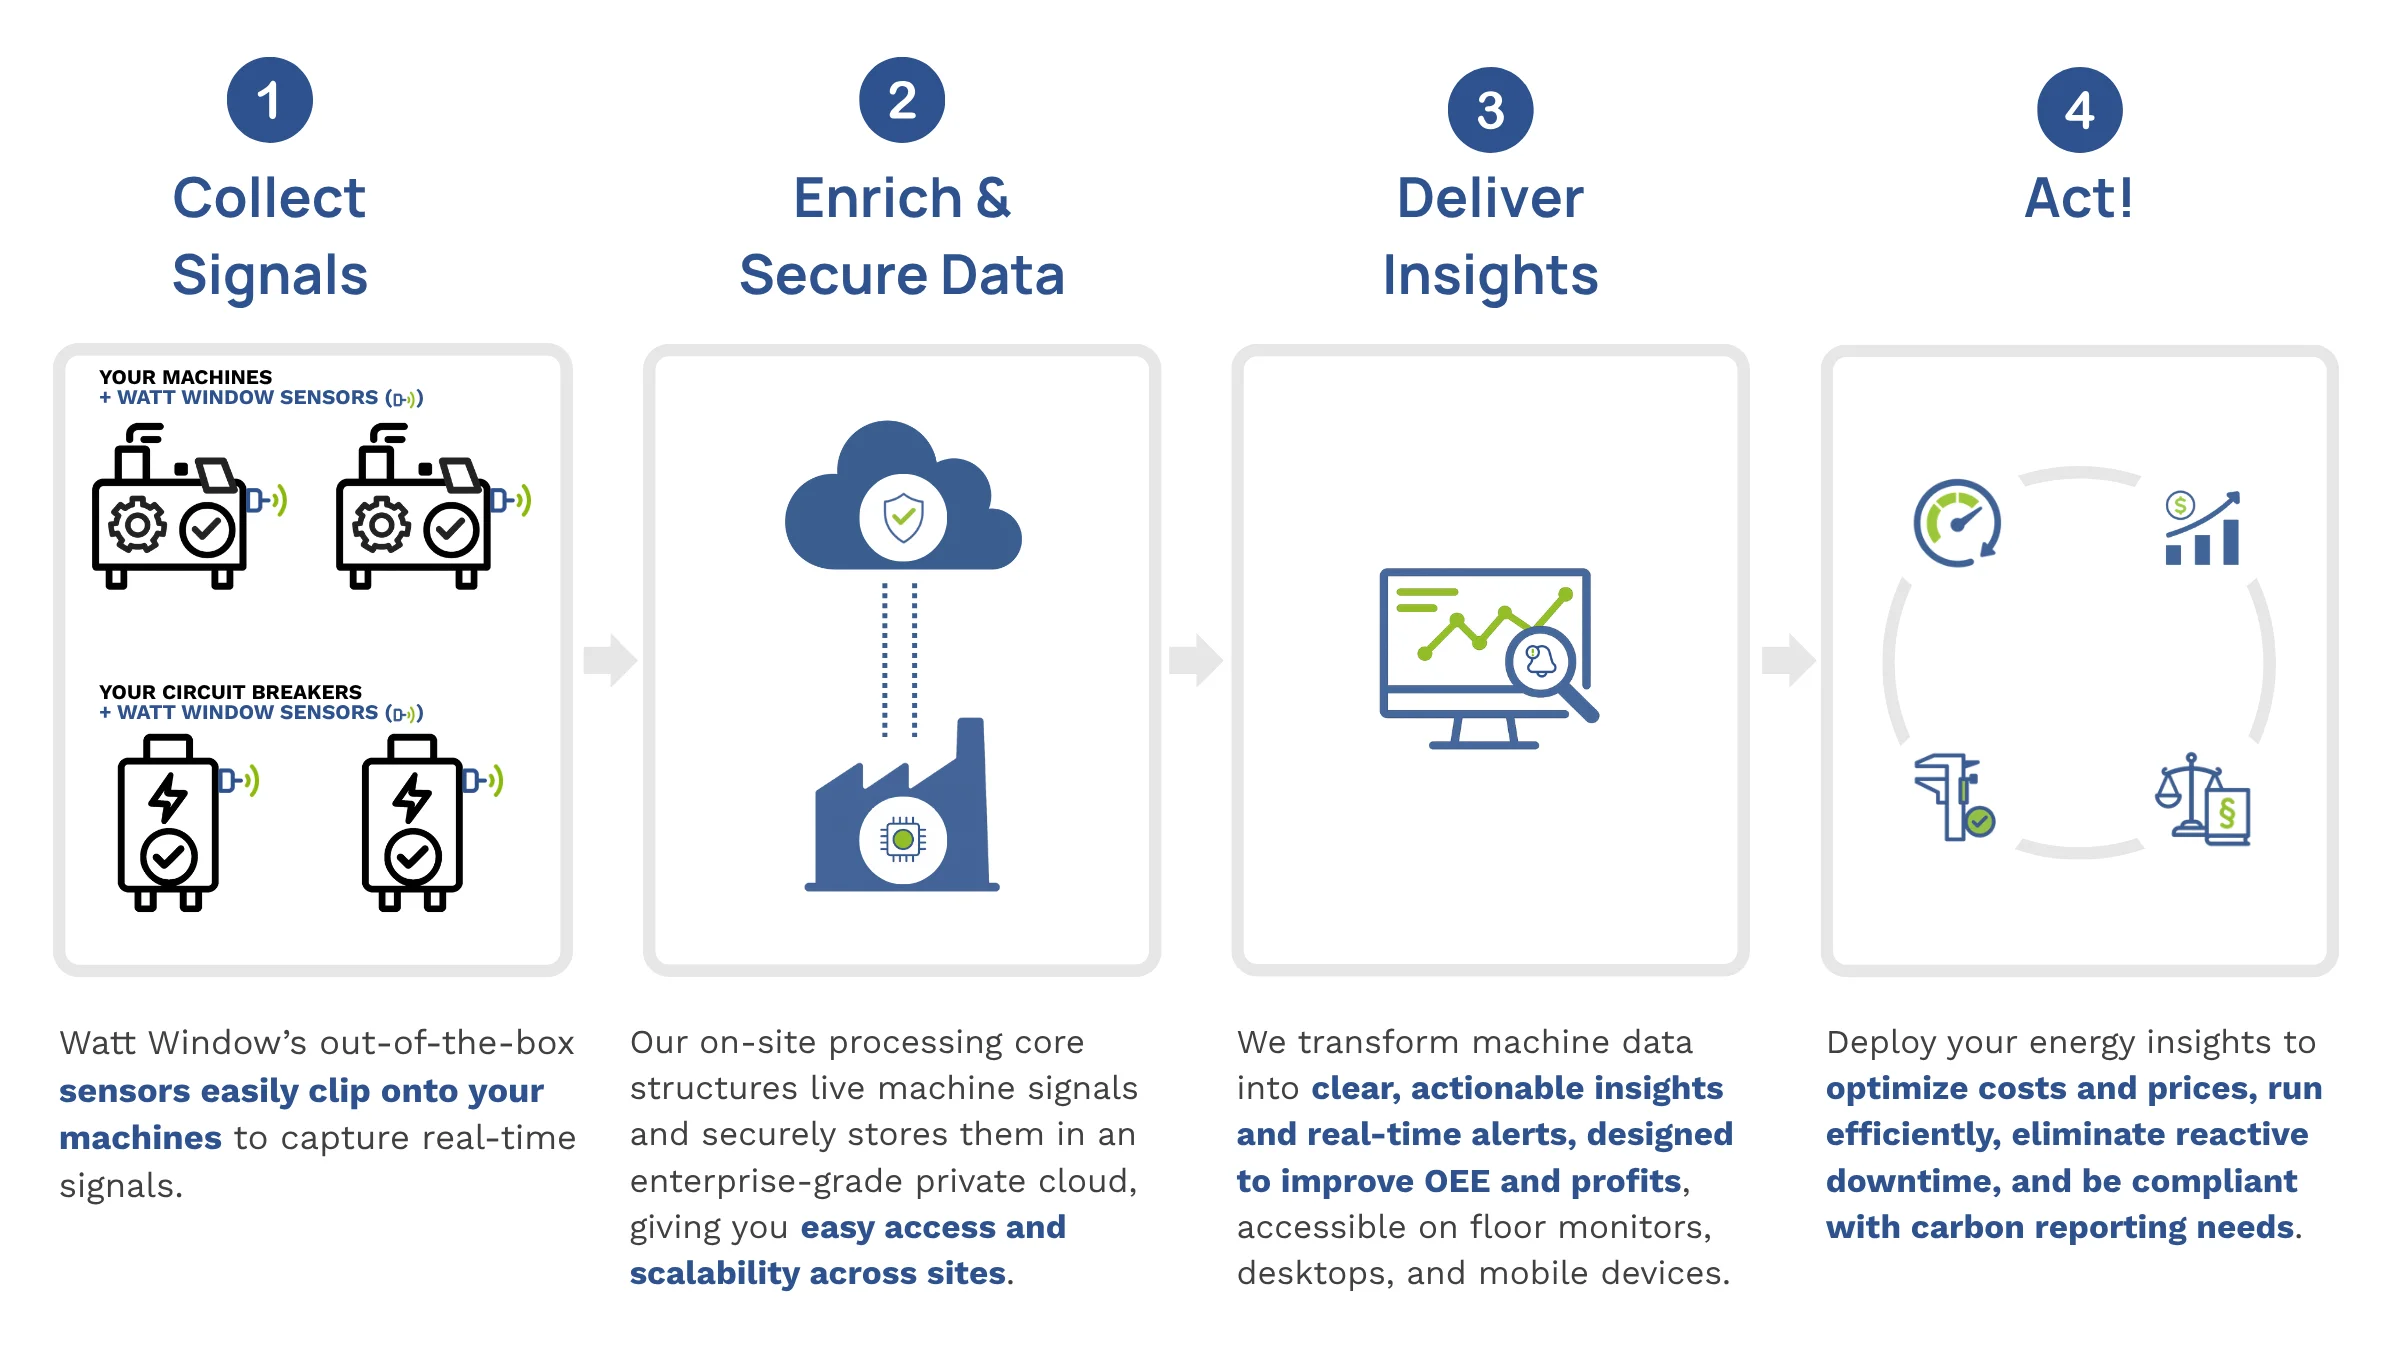
Watt Window captures continuous, high-resolution energy and load data at machine or line level. That data supports diagnostics, savings or ROI validation, and strengthens your credibility.
Enhance audit depth without heavy installs.
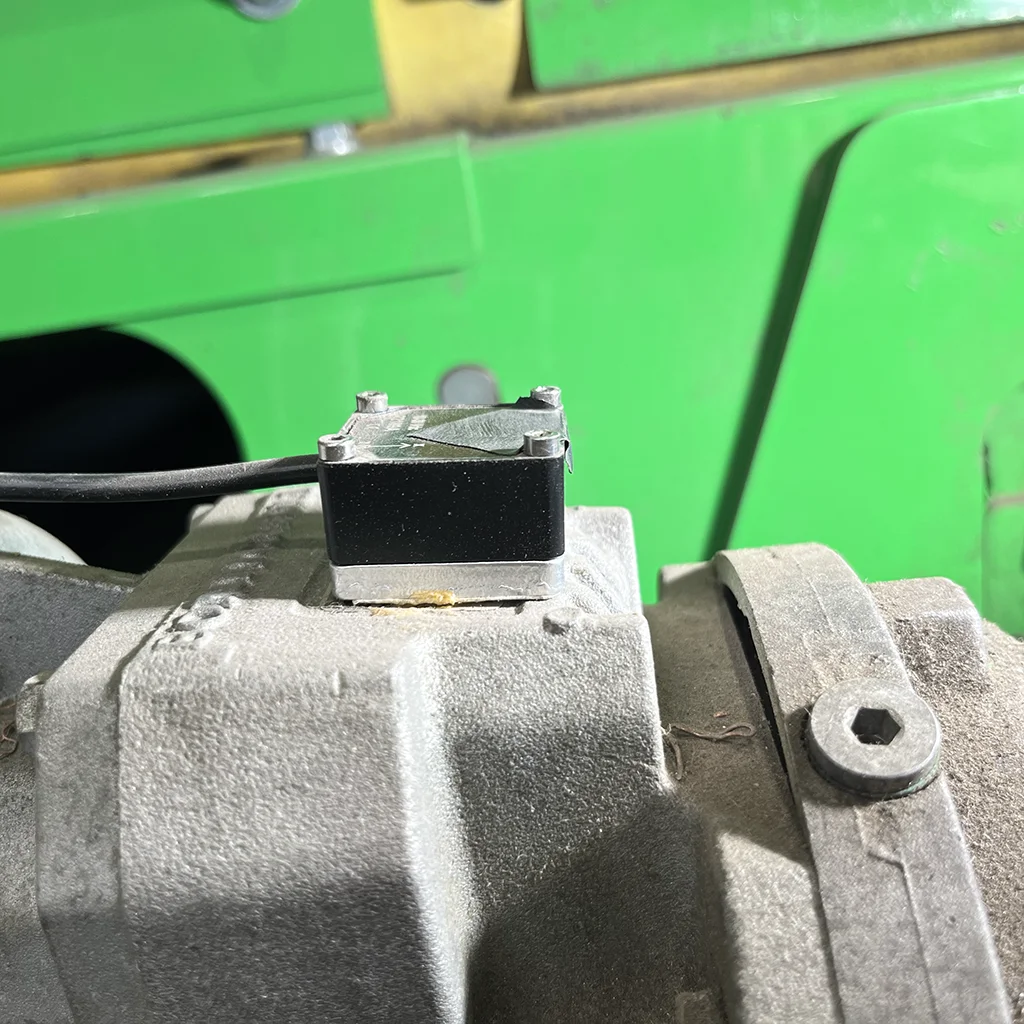
For monitoring kits and temporary measurements, Watt Window integrates as a read-only layer on incumbent electrical infrastructure.
Installation stays light, which makes it practical for baselines, benchmarks, and project validation without heavy automation overhead.
Offer granular insights for long-term energy strategies and audits
Continuous monitoring surfaces hidden energy drains, peak loads, and reliability risks that are often invisible in utility-bill-level reviews.
That enables more precise, actionable recommendations for cost, carbon, maintenance, or process improvements.
The bottom line for you
Facilities often lack detail below aggregated energy bills. Watt Window offers near-live visibility and clarity.
That data helps consultants deliver recommendations rooted in real evidence, measurable change, and credibility that stands up under scrutiny.
Energy cost resolution for industry
Watt Window provides industrial-grade monitoring hardware that installs as a read-only layer on existing electrical systems.
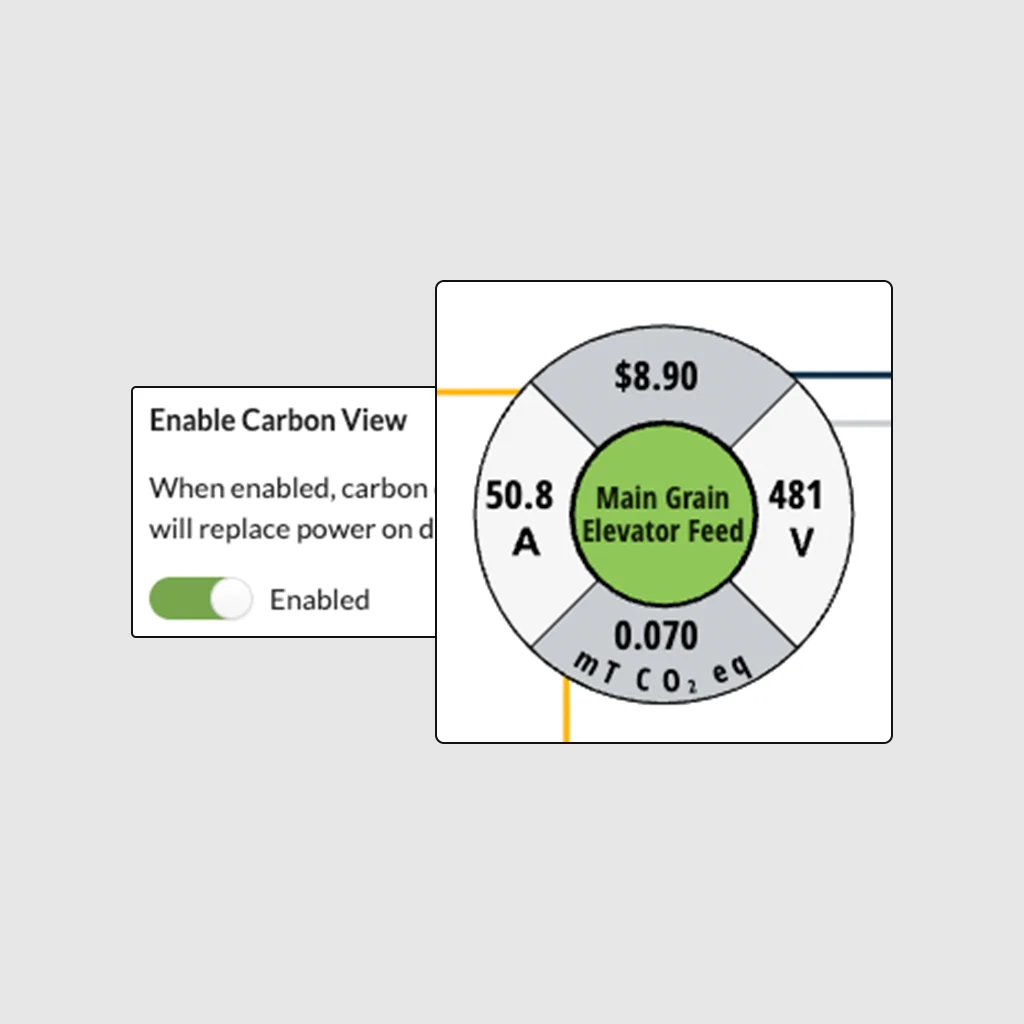
It captures frequent energy, thermal, vibration, and electrical data across machines and lines. The system converts those signals into usable metrics such as energy consumption, load profiles, carbon-equivalent data, and equipment health indicators. These support audits, retrofits, benchmarking, and validation.
Learn how Watt Window supports your audits and improvement efforts
Talk with our team and get a live solution overview