How Watt Window® helps glass manufacturers
Bring clarity to energy use across furnaces and lines.
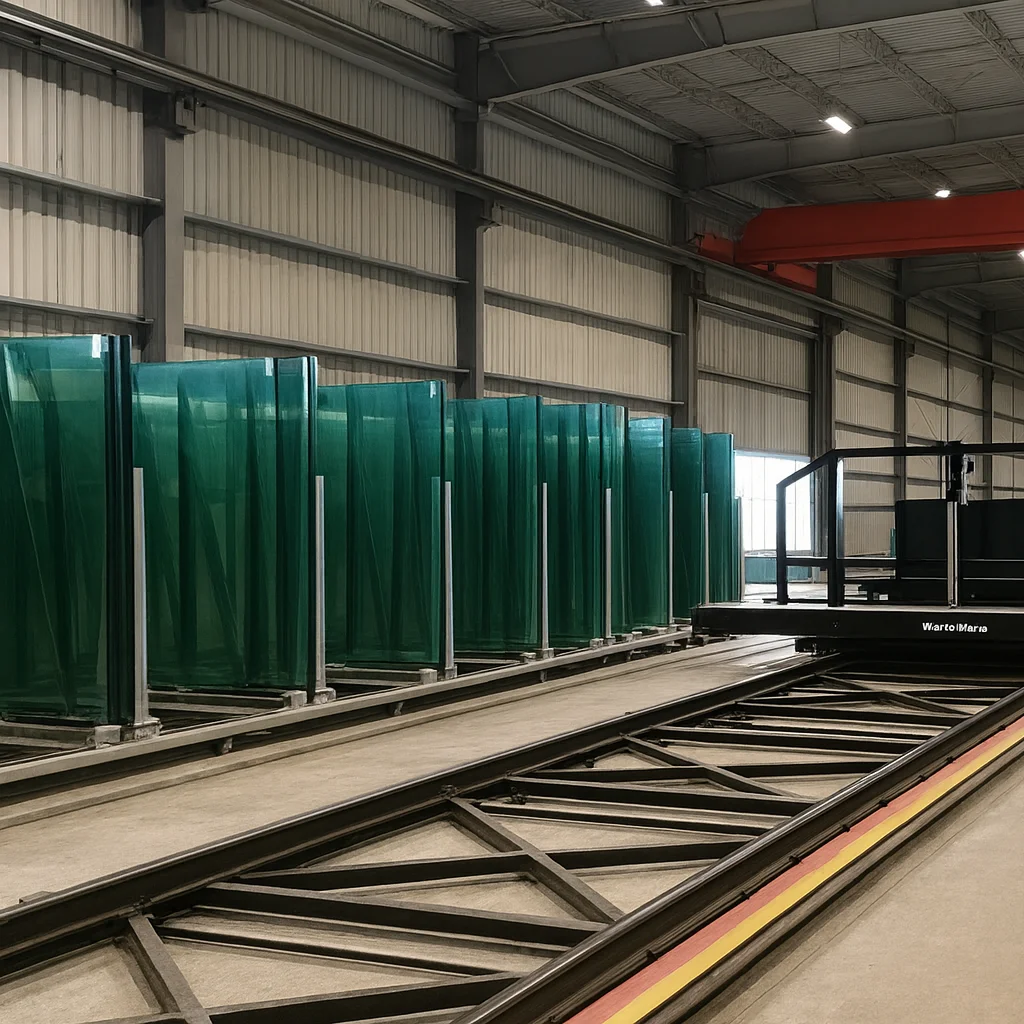
As you manage energy-intensive glass operations, electricity cost and load stability play a direct role in margins and production consistency.
Watt Window provides clear, load-level visibility into how you use energy across furnaces, forming lines, and downstream equipment.
Actionable Insights for glass production

Load -level energy visibility
Understand how furnaces, blowers, forming lines, and conveyors draw power over time.
Operational stability
Identify unusual load behavior that may signal inefficiency or emerging stress before quality or throughput is affected.
Energy and emissions insight
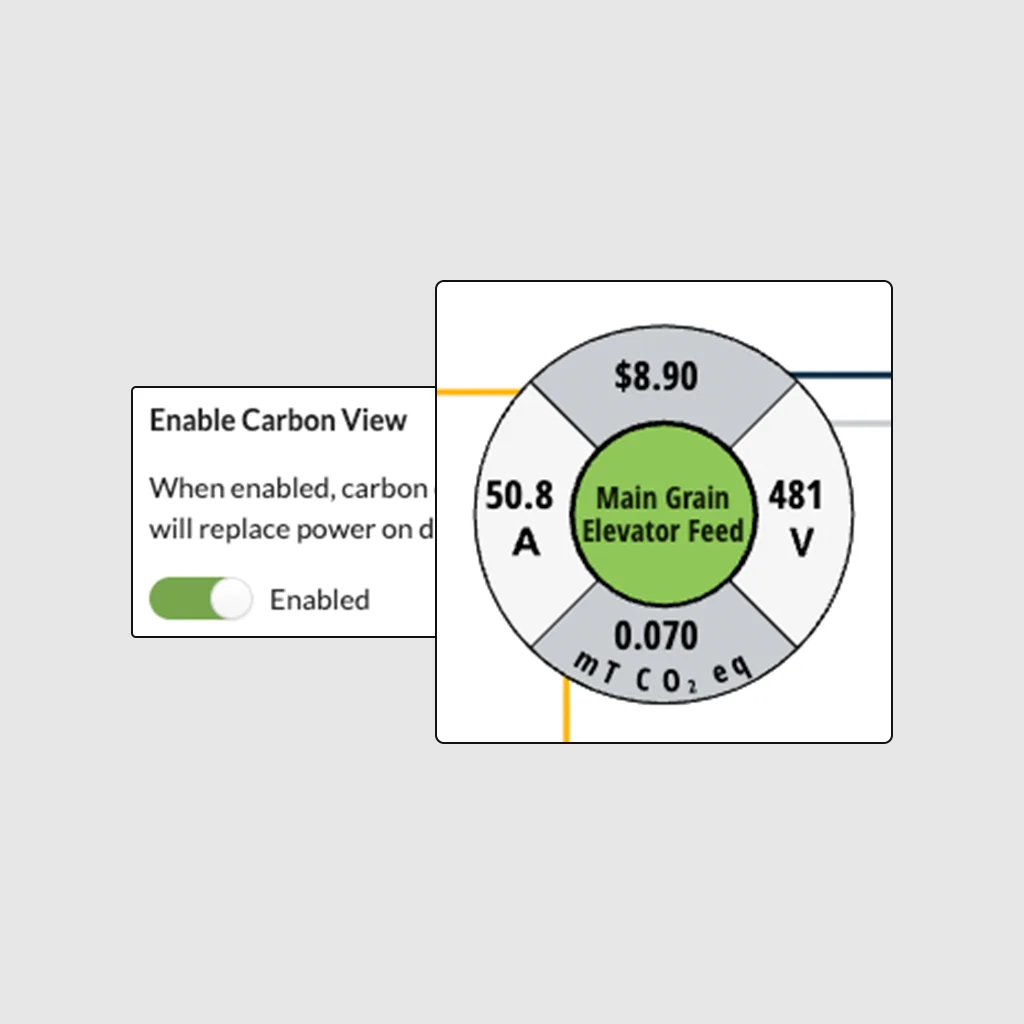
Track electricity-driven cost and carbon impact where reporting or customer requirements apply.
See where energy cost concentrates.
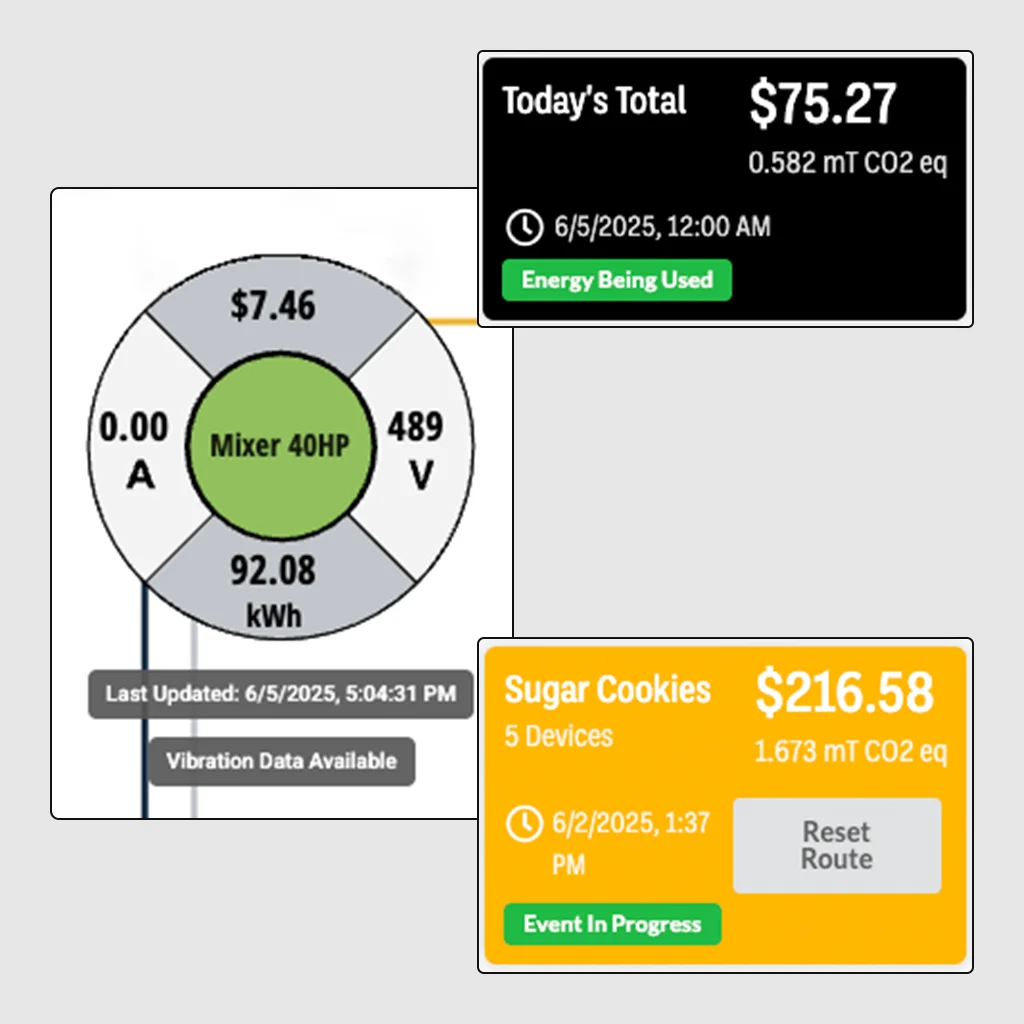
Watt Window captures frequent energy data by circuit or load group.
That allows teams to see which parts of the operation drive electricity cost at different points in the production cycle, instead of relying on plant-level averages.

Respond confidently to changing operating conditions.
As throughput, temperature control, or line utilization shift over time, live energy data helps operators detect load changes early and adjust operations before inefficiencies compound.
Provide reporting-ready energy data when required.
Where customers or regulators request energy or emissions data tied to production, Watt Window delivers reliable electricity-use data and data-derived carbon-equivalent metrics without exposing process recipes or proprietary parameters.

Integrate cleanly into existing infrastructure.
The system installs as a read-only layer on existing electrical equipment.
No changes to control systems or production logic are required, making deployment feasible in operating plants or during planned downtime.
The bottom line for you
Glass manufacturers operate with high energy intensity and tight tolerances.
Watt Window turns electricity use into actionable insight, helping teams manage cost, maintain operational stability, and support reporting requirements when needed.
Energy cost resolution for industry
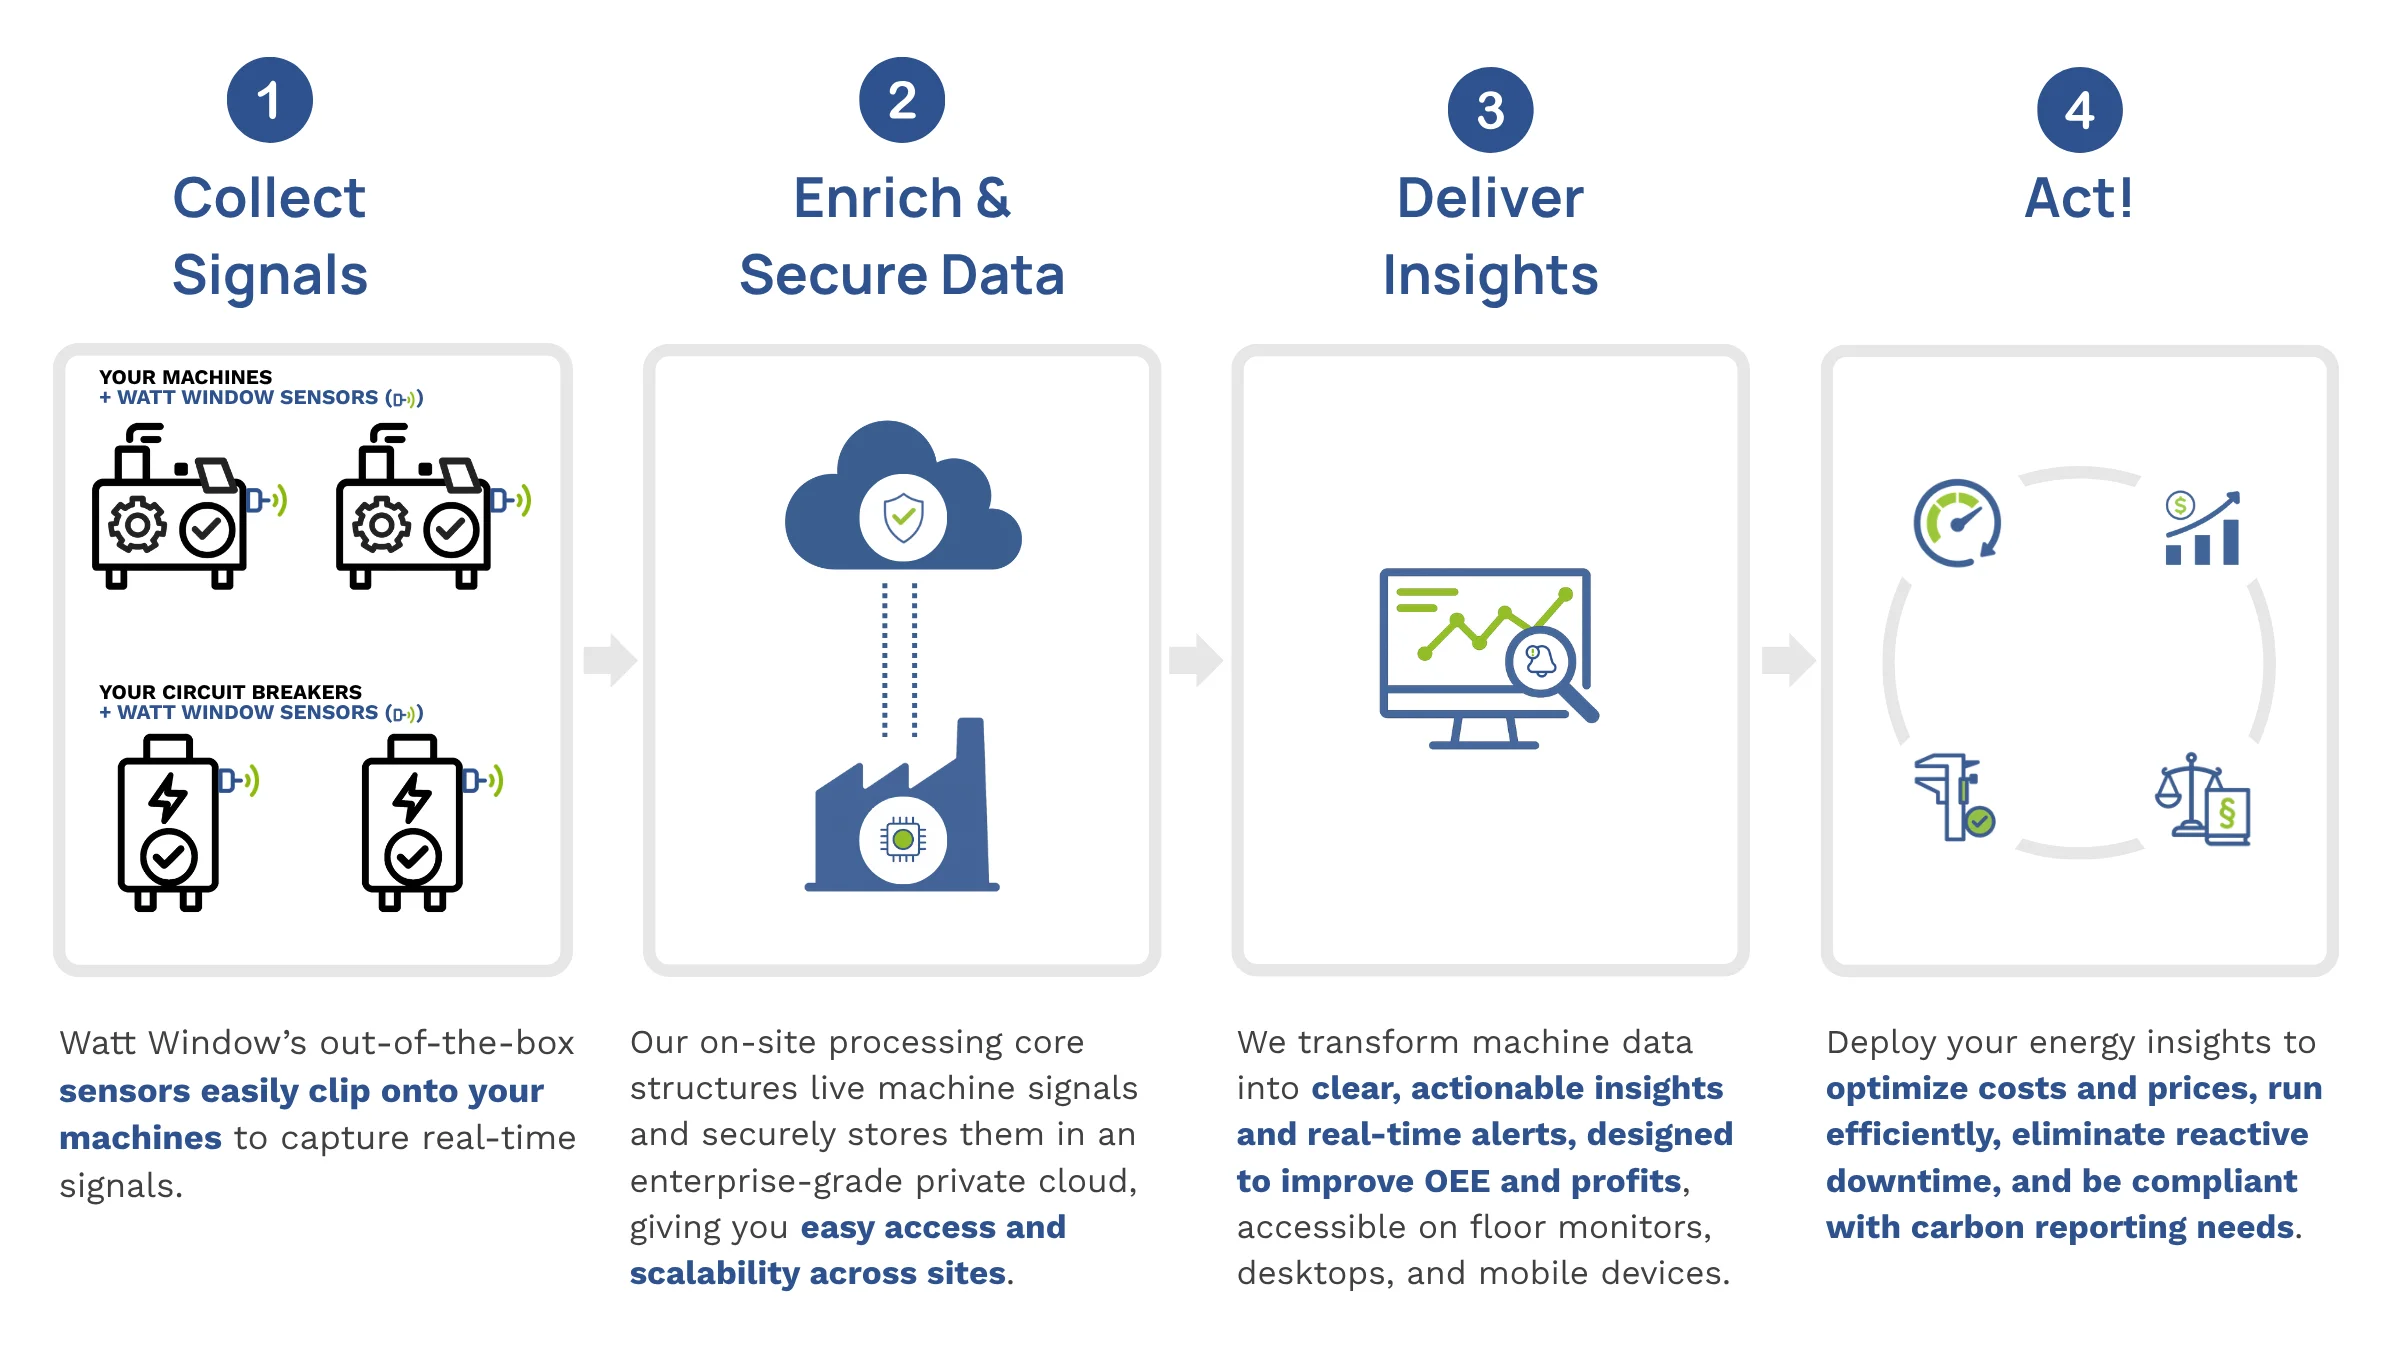
Watt Window provides configurable, UL-listed smart-metering and monitoring hardware for industrial electrical systems.
Once installed, it captures frequent energy, electrical, thermal, and optional vibration data across furnaces, lines, and supporting equipment. The system converts that data into dashboards showing energy consumption, load behavior, cost attribution, and carbon-equivalent emissions for electricity use.
See How Watt Window fits glass manufacturing.
Talk with our team and get a live solution overview