How Watt Window® helps food, beverage, & animal feed makers
Track energy by batch. Control costs. Boost reliability.
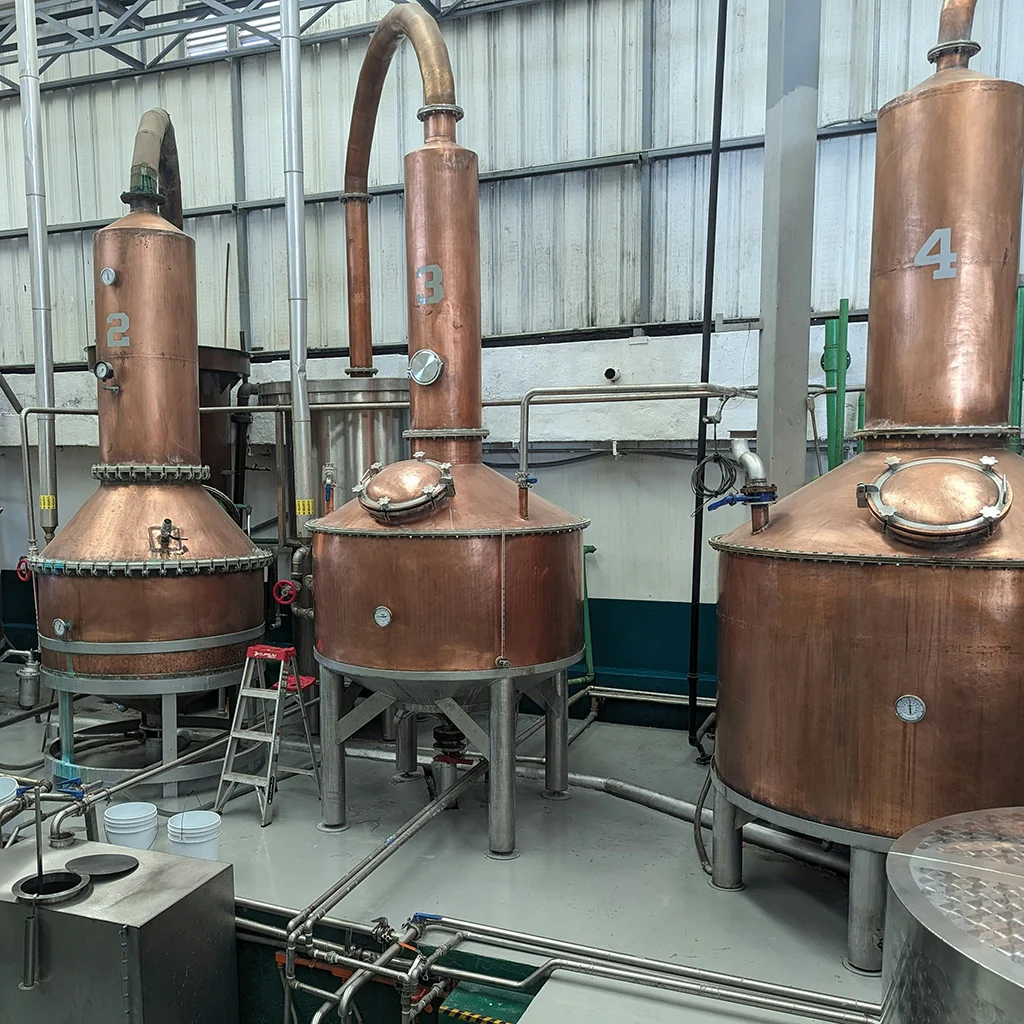
Whether you operate a food-processing line or an animal-feed mill, each production run may vary in load, recipe, drying, mixing, refrigeration, or packaging demand.
Watt Window gives you machine- and line-level energy tracking so you can allocate energy cost per batch, uncover inefficiencies, and strengthen cost control and operational resilience.
Actionable Insights for batch-driven production
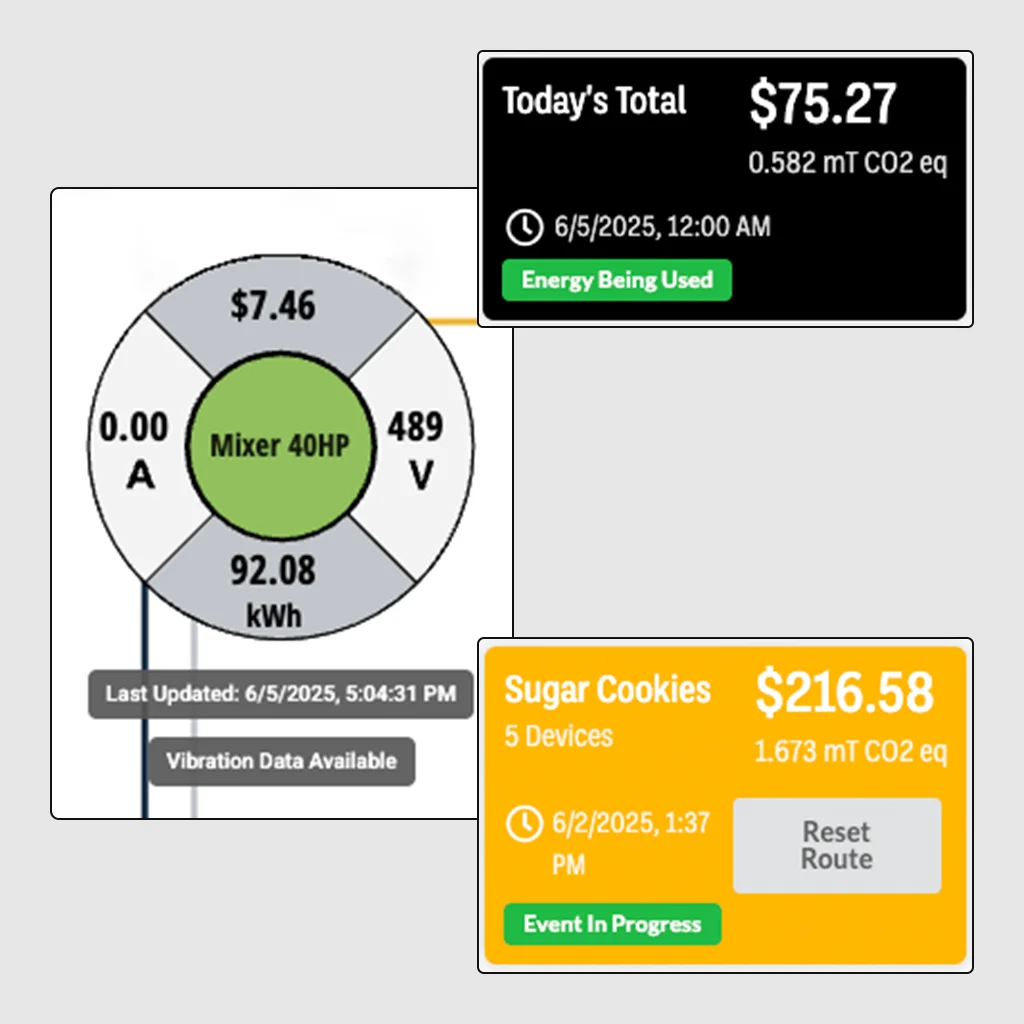
Batch-level energy transparency
See how energy use changes by recipe, batch size, or run conditions.
Process stability
Detect abnormal load or heat behavior before it disrupts production or safety.
Cost and compliance visibility
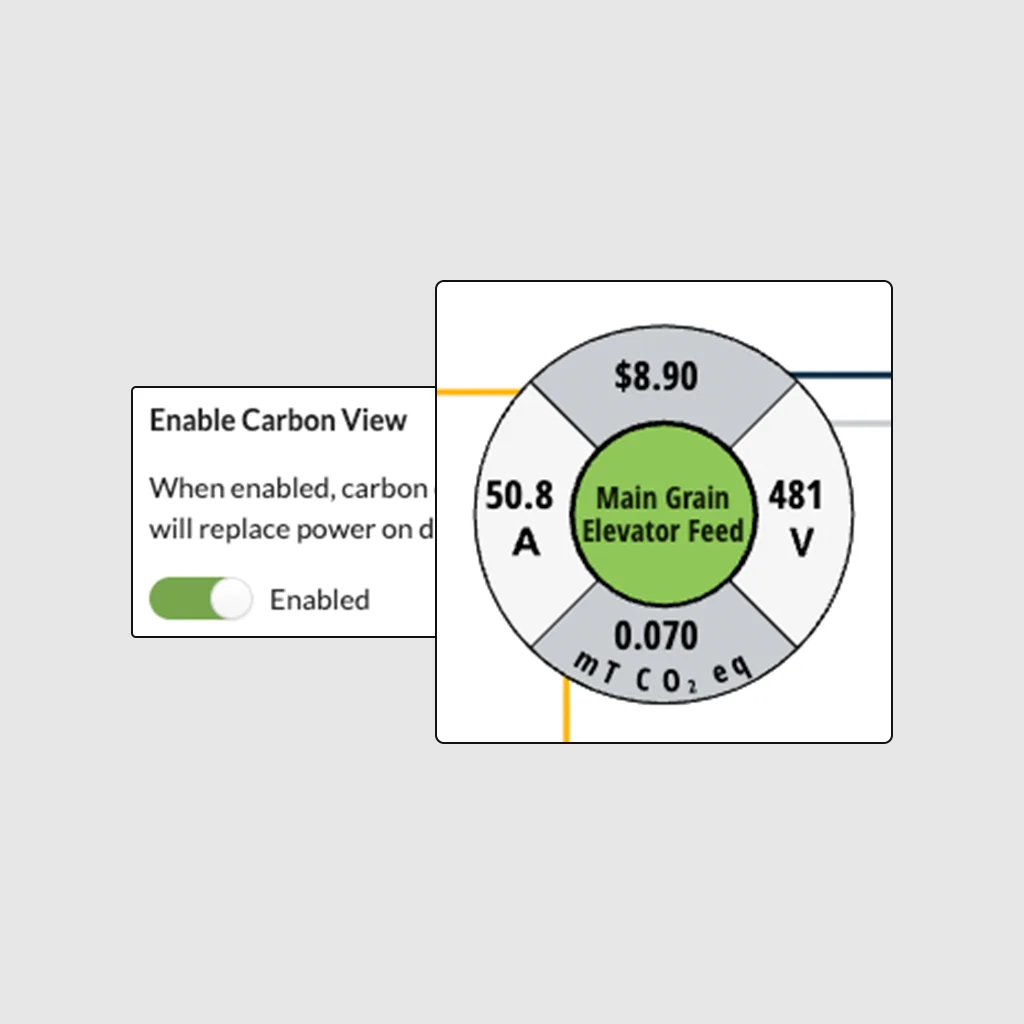
Provide clear energy and emissions data when customers or regulators require it.
Assign real energy cost per batch or production run.
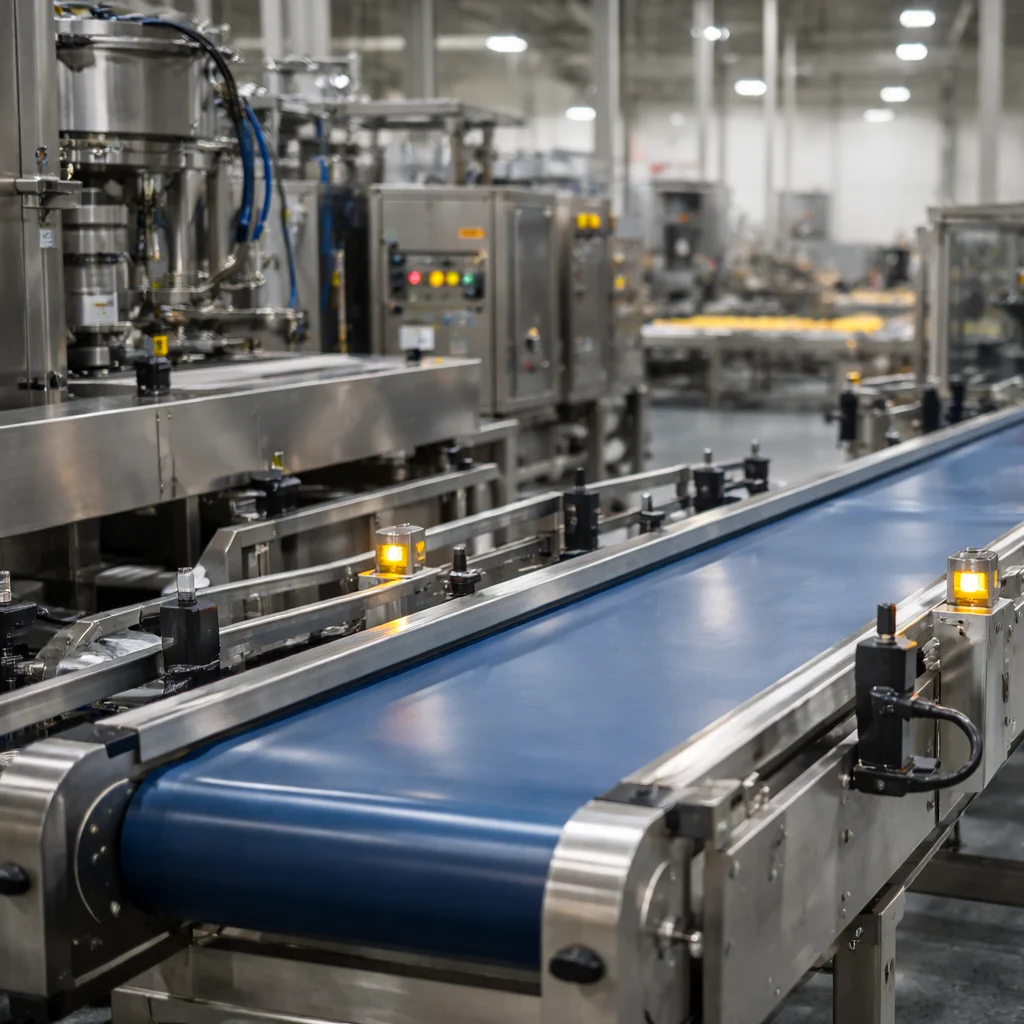
Across the production line, from ovens and dryers to mixing, conveying, refrigeration, and packaging, energy demand varies with changing load conditions.
Watt Window logs energy use by load group and at fine resolution. That lets you link electricity use to specific batches, recipes, or runs. This supports accurate costing, pricing, and margin tracking for every product.
Reveal hidden inefficiencies and energy waste.
Utility-level meters mask idle draw, peaks, or inefficiencies.
But node-level, near-live monitoring helps detect wasteful patterns, under-utilized equipment, or excessive load during off-peak or change-over periods. Over time this yields energy savings and improved operational discipline.
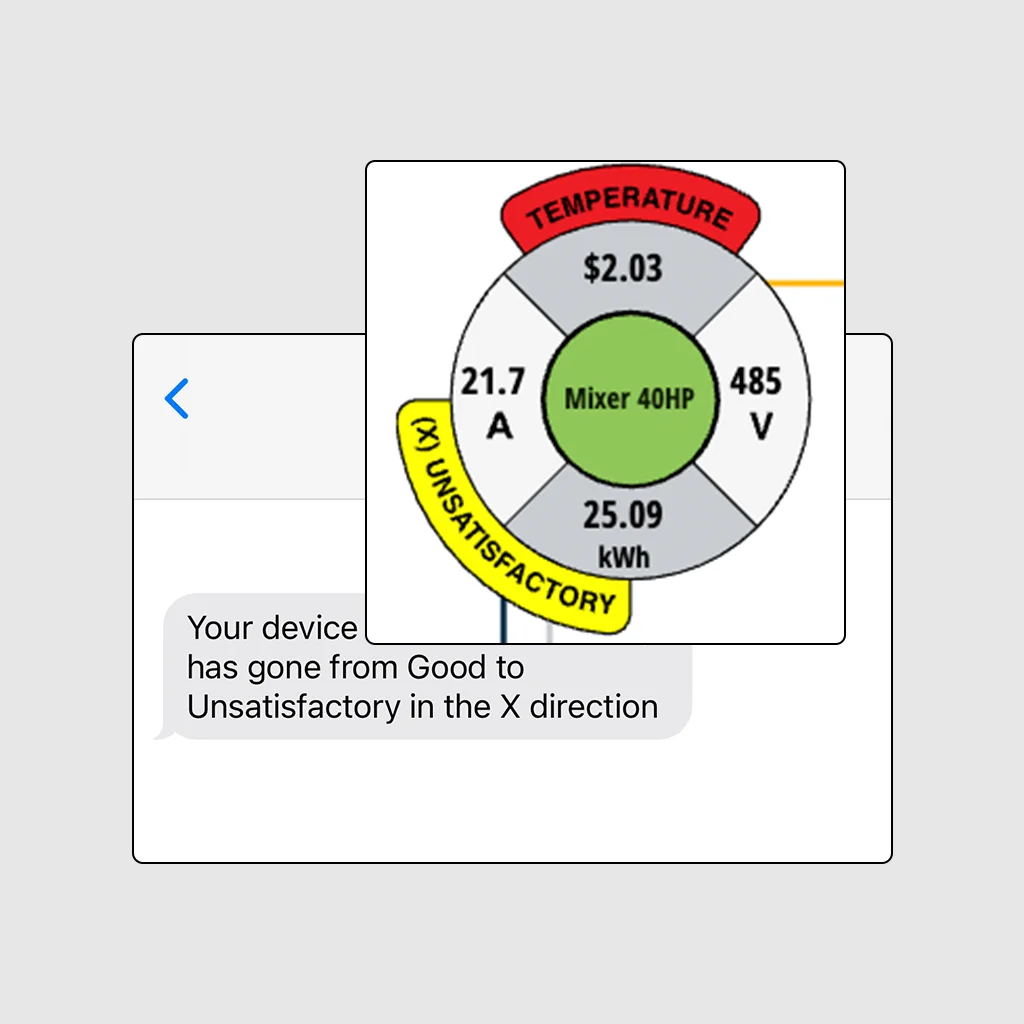
Support maintenance, safety, and condition awareness when it matters.
Process equipment such as dryers, mixers, ovens, conveyors, compressors can degrade, overheat or draw excess power over time.
Watt Window monitors energy, thermal, vibration, and electrical signatures where applied and alerts teams to anomalies. That helps operators act before issues escalate, useful for reliability, safety, and potential insurance or risk mitigation efforts.
Offer data for energy-cost control or emissions reporting when required.
Energy input often represents a major share of processing costs in food and feed plants.
If clients or regulators require energy-use or emissions transparency, Watt Window provides accurate electricity-use data and derived carbon-equivalent metrics. That supports reporting and traceability without exposing process logic or proprietary recipes.
Install with minimal disruption and preserve process integrity.
Watt Window hardware integrates with the electrical infrastructure, without interfering with control systems or process automation.
That makes retrofit or upgrade deployment feasible during planned downtime, avoiding disruption to production or sanitation workflows.

The bottom line for you
Food and feed production environments constantly deal with variable loads, batch changes, and margin pressure.
Watt Window converts energy consumption into clear data. That enables batch-level cost allocation, improved energy discipline, earlier maintenance awareness, and flexibility to support client or regulatory transparency needs.
Energy cost resolution for industry
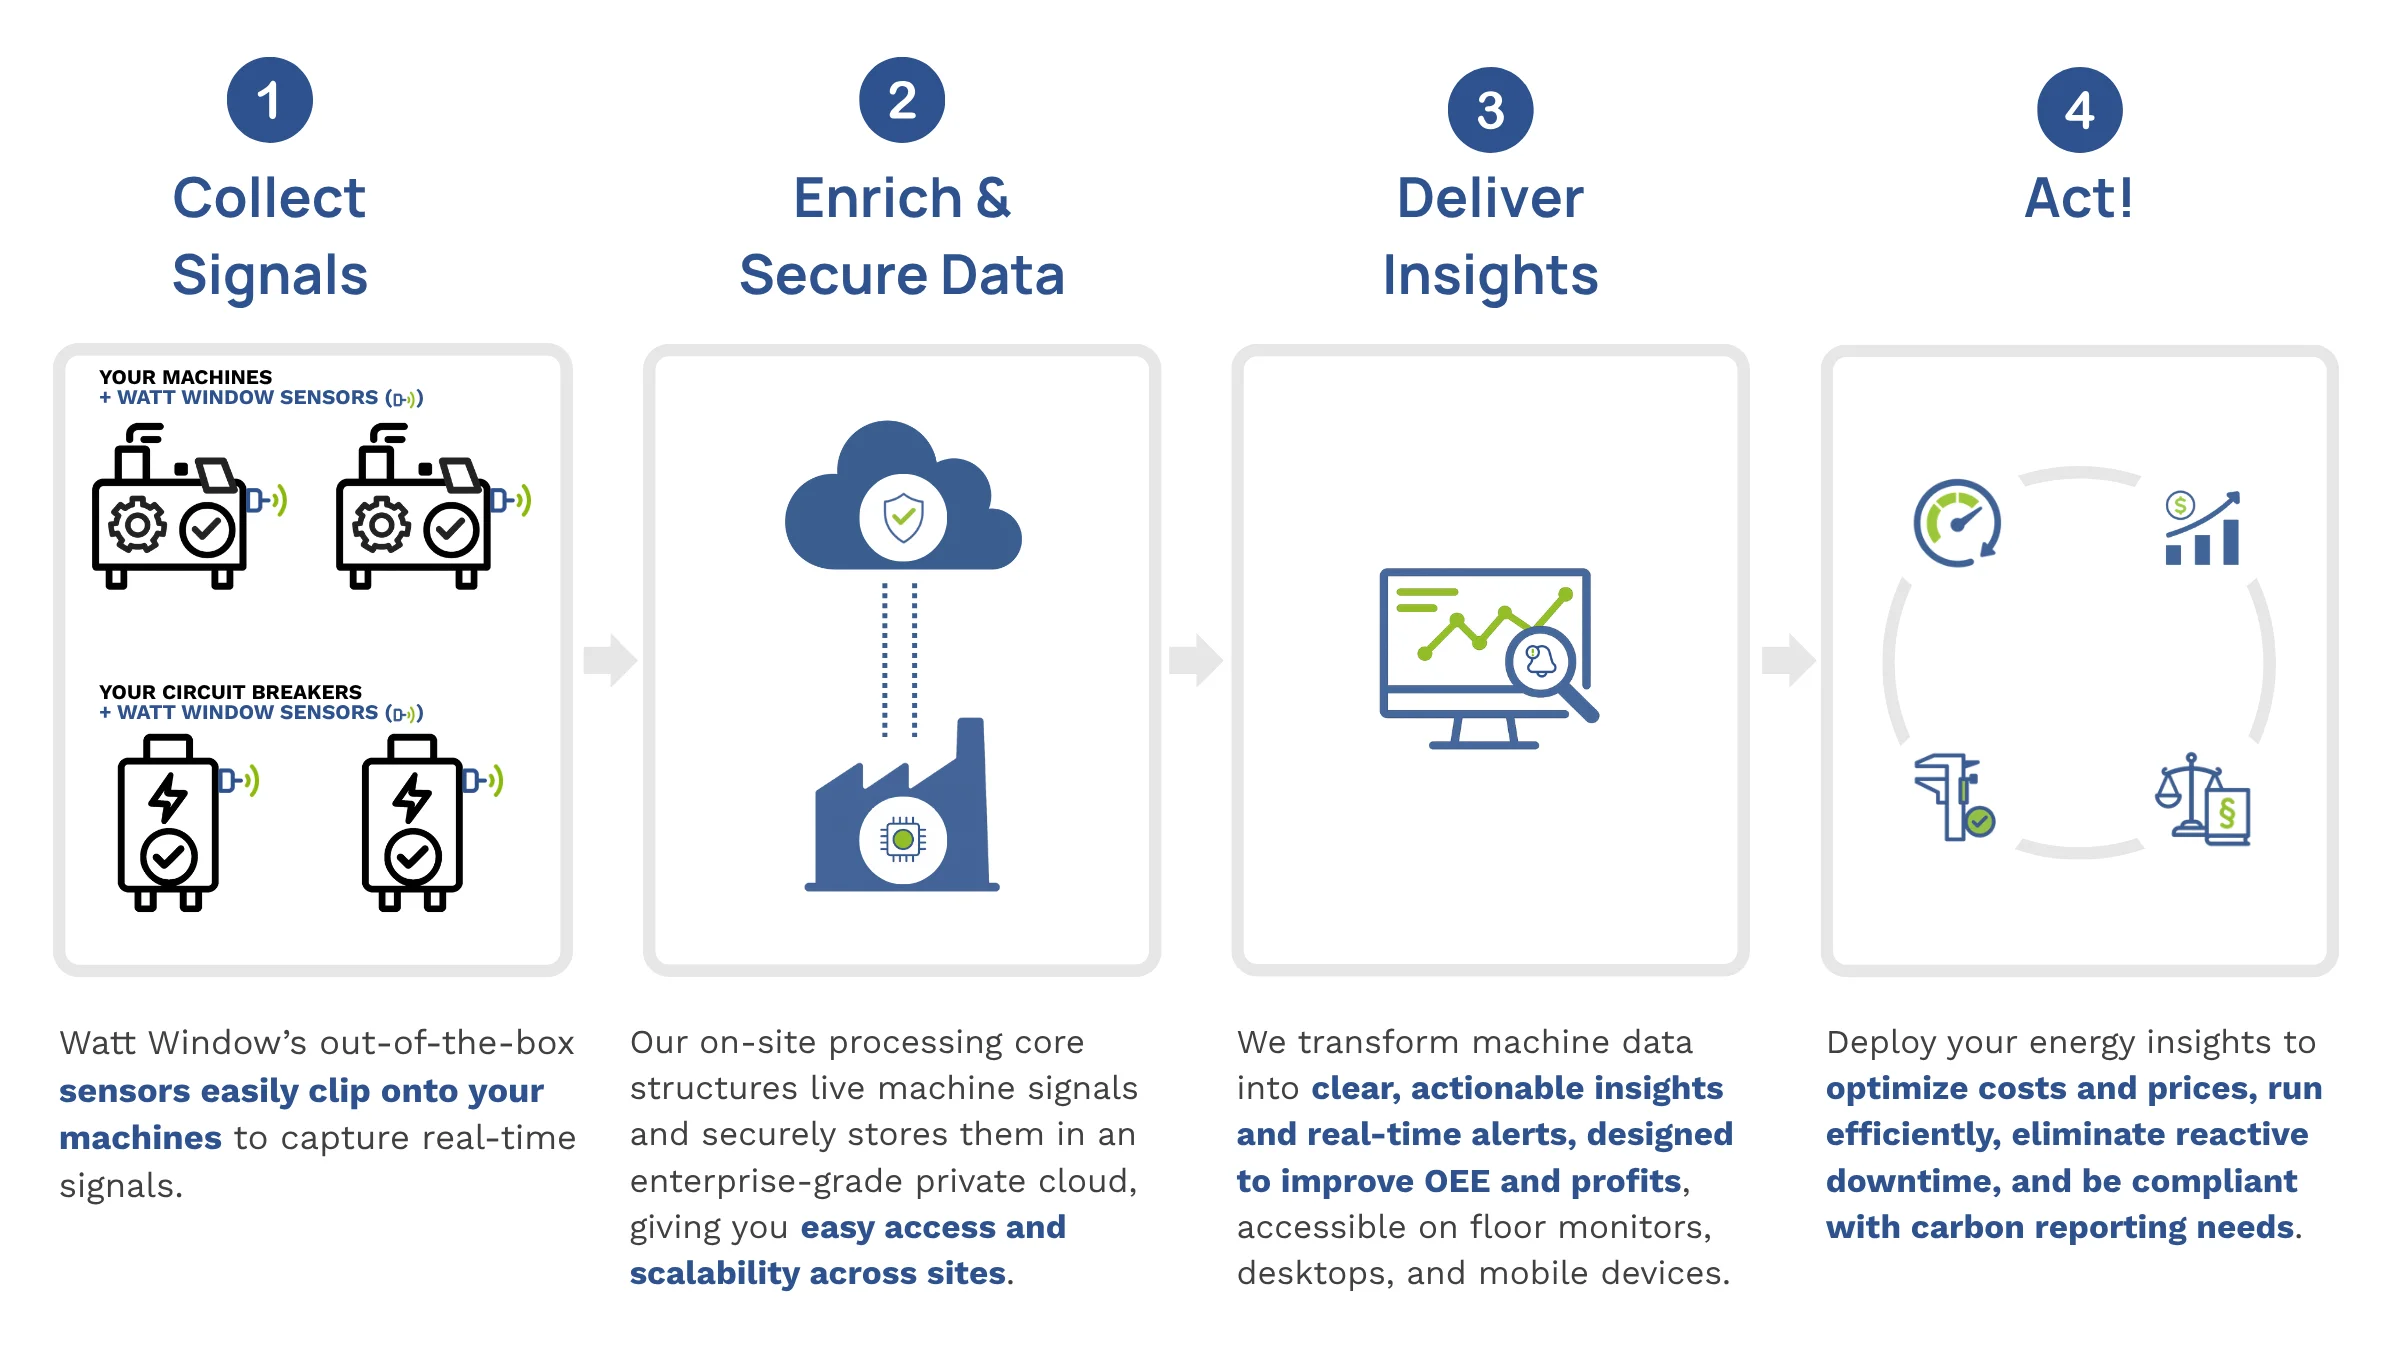
Watt Window supplies configurable, UL-listed smart-metering and monitoring hardware suitable for industrial electrical systems in food and feed facilities.
After installation it records frequent energy, thermal, electrical, and optional vibration data across machines, lines, or load groups. The system delivers dashboards showing energy consumption, load profiles, cost attributions, carbon-equivalent emissions (when needed), and alerts for load anomalies, giving operators and managers actionable visibility without touching control logic or compromising hygiene or regulatory requirements.
See How Watt Window supports food and feed operations.
Talk with our team and get a live solution overview