
How Watt Window® helps dry cement manufacturers
Bring clarity to energy use. Protect margins.
With electricity playing a central role in milling, grinding, and material handling, Watt Window provides near-live, load-level energy data for high-resolution production monitoring.
That enables you to track energy cost by process or shift, reveal inefficiencies, and make informed operational decisions under tight margin pressure.
Actionable Insights for cement operations
Energy transparency
Understand how grinding, milling, and material handling loads drive electricity cost.
Cost control under pressure
Identify where energy intensity shifts with throughput or material conditions.
Reporting-ready data
Generate reliable energy and emissions data for internal management or external needs.
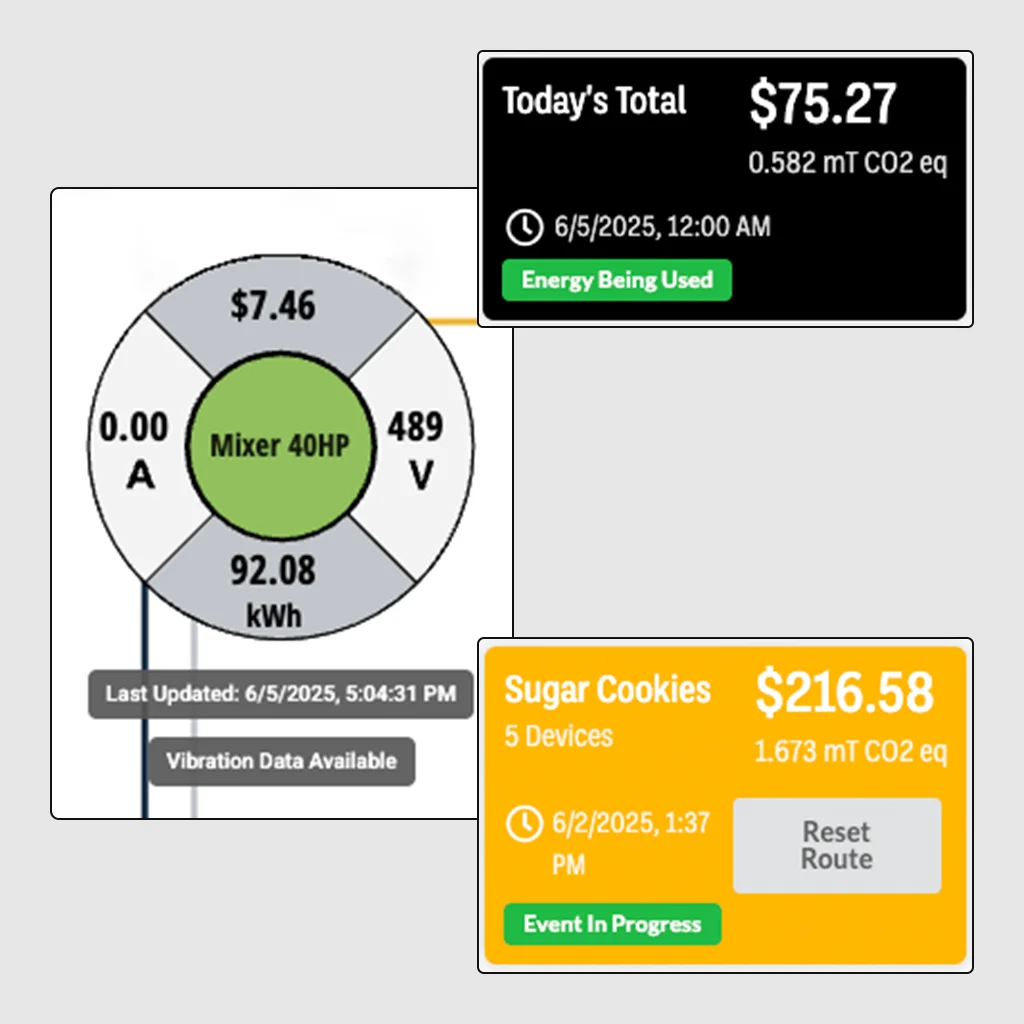
Understand true energy cost by process and shift.
Energy constitutes a major share of production cost in cement manufacturing.
Watt Window records energy use per circuit or load group at frequent intervals. That delivers clear insight into which mills, grinders, conveyors, or fans consume the most electricity (and when). Teams can then improve scheduling, cost tracking, and load optimization.
Adapt operations when power costs or demand fluctuate.
Cement production often experiences variation in load demands tied to material conditions or throughput.
Near real-time load visibility makes it easier for operators to shift heavy-load tasks, throttle usage, or reschedule processes to reduce cost exposure when power prices spike.
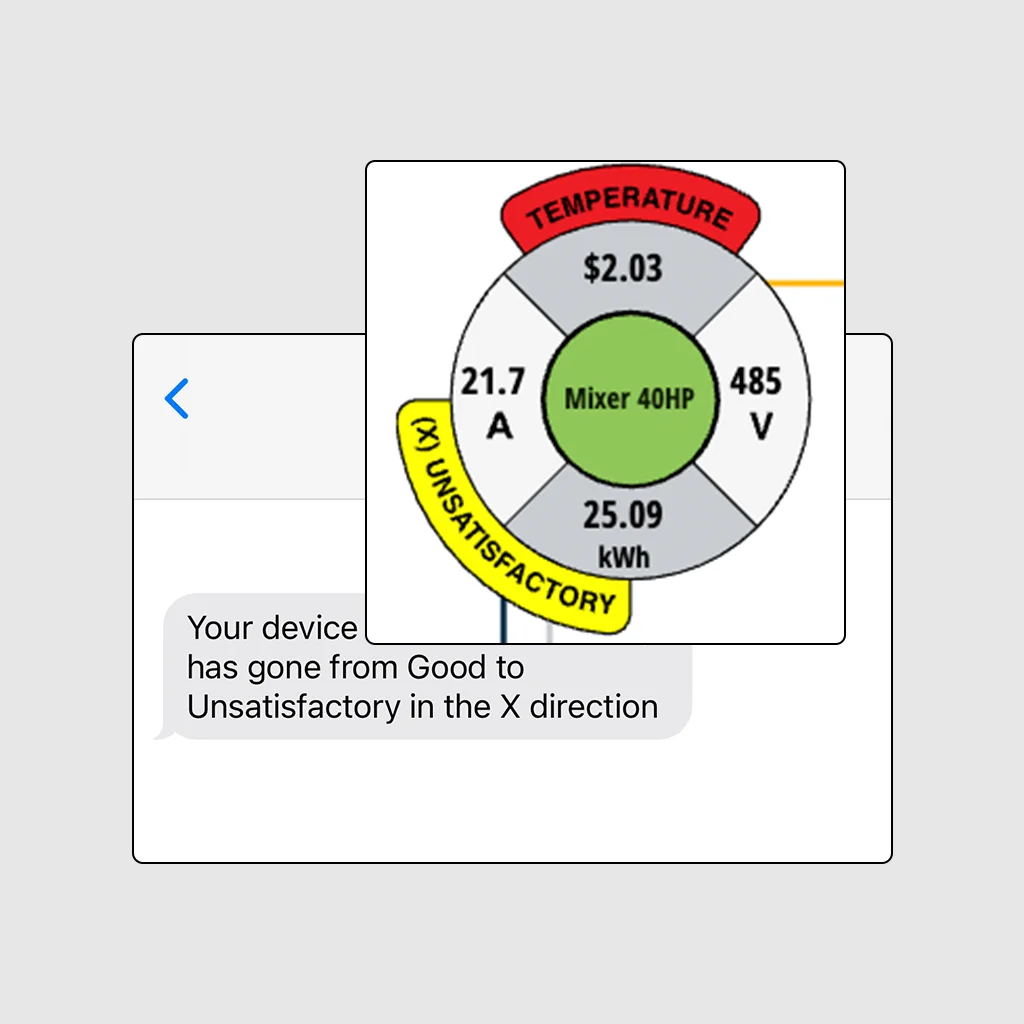
Support maintenance awareness via load and condition signals.
Grinding and milling systems can experience wear, misalignment, or efficiency loss over time.
Watt Window’s continuous monitoring may surface unusual power draw or load spikes, alerting operators to conditions that warrant further inspection to prevent unexpected downtime.
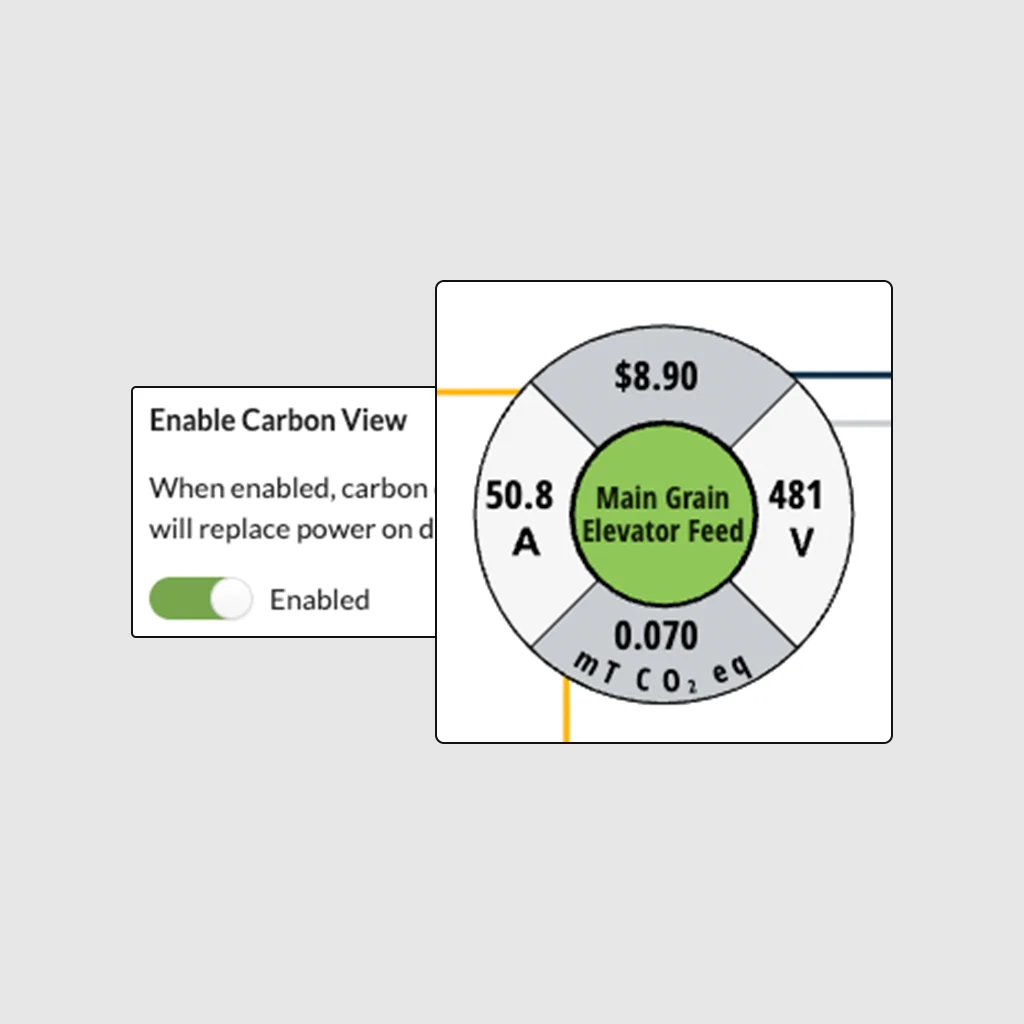
Gather data for energy management and carbon reporting when required.
For electricity-driven processes, Watt Window delivers verified energy-use data and derived emissions metrics.
That supports internal energy-management goals or external reporting without touching fuel-based emissions calculations.
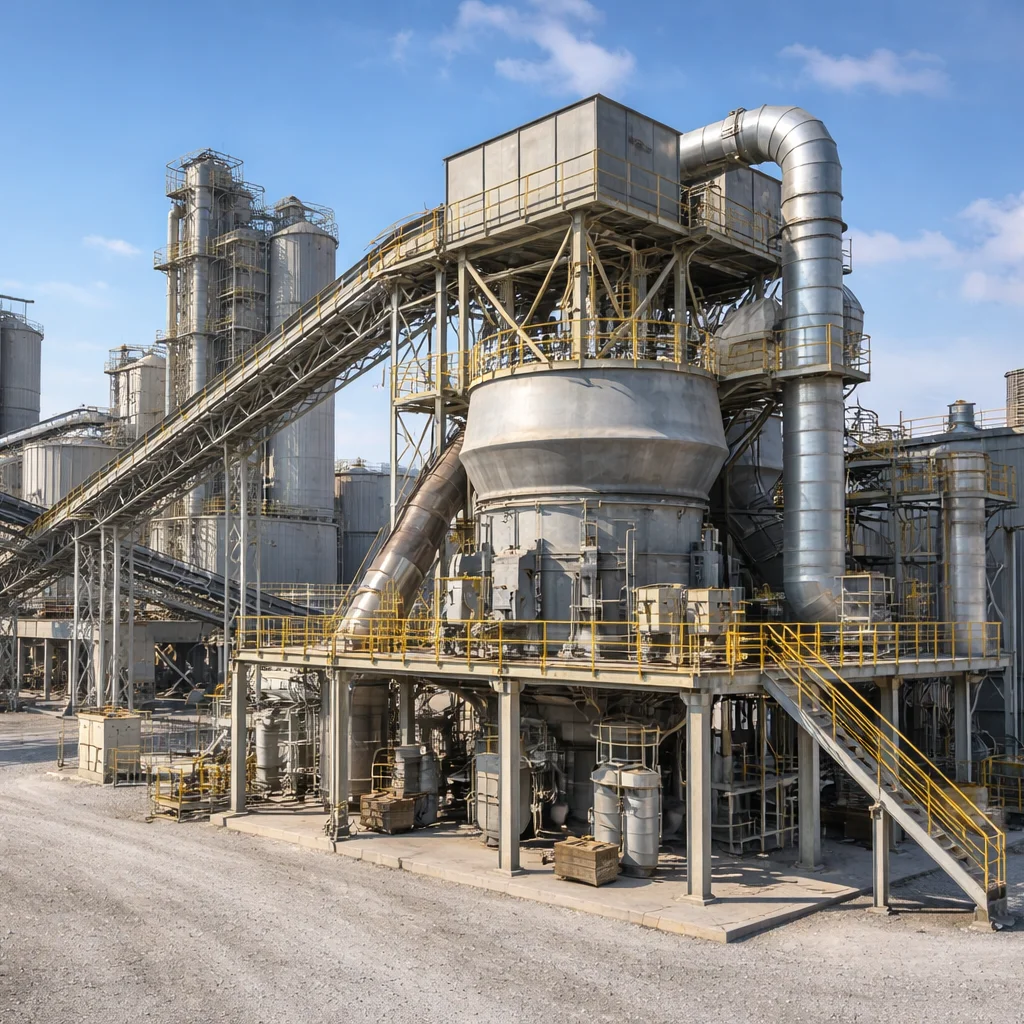
Install with minimal disruption.
The solution is modular and compatible with existing electrical infrastructure.
Licensed electricians can fit it without altering control logic or process wiring, making it viable even in active plants or retrofits.

The bottom line for you
Dry cement plants face substantial energy costs and volatile demand.
Watt Window delivers visibility and insight into energy consumption and load behavior. That supports cost control, operational flexibility, maintenance awareness, and potentially energy-management or reporting goals.
Energy cost resolution for industry
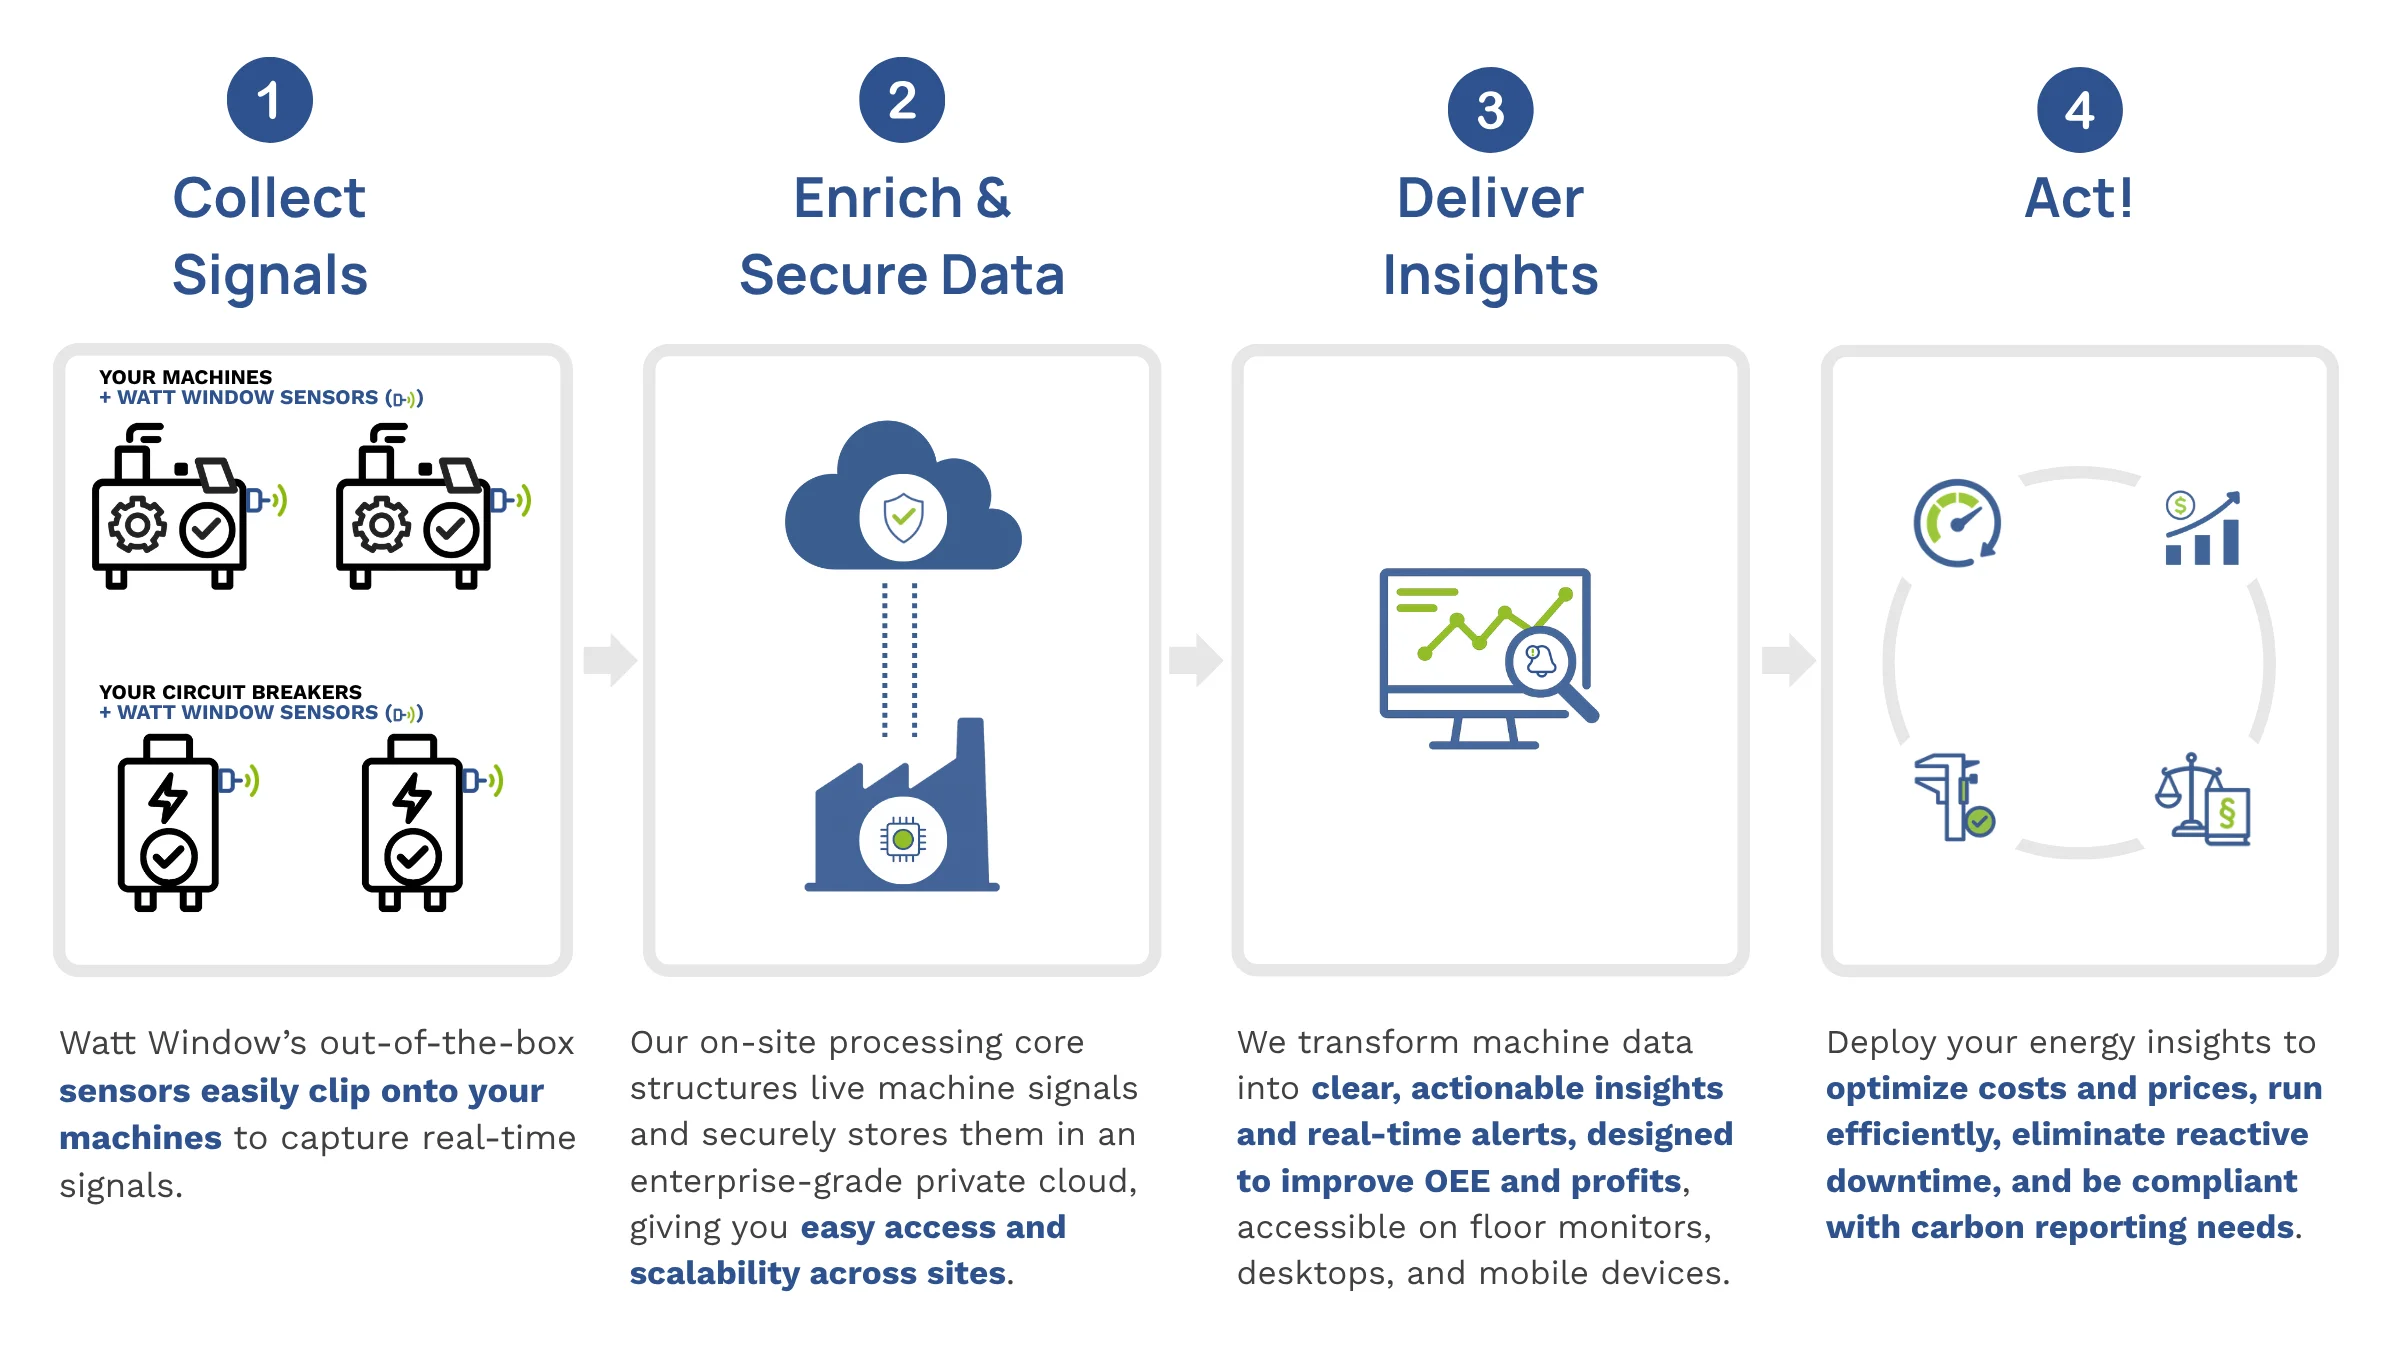
Watt Window offers configurable, UL-listed smart-metering and condition-monitoring hardware for industrial electrical systems.
Once installed, it collects frequent energy, electrical, thermal, and vibration data across mills, grinders, conveyors, fans, and load groups. The system converts that data into meaningful metrics such as energy use, load profiles, cost, carbon footprint, and equipment-stress indicators. These are visible in dashboards built for plant teams.
See How Watt Window supports cement plant operators
Talk with our team and get a live solution overview